Colorado Secretary of State election, 2018
 From Ballotpedia - Reading time: 24 min
- General election: Nov. 6
- Voter registration deadline: Oct. 29[2]
- Early voting: Mail ballots available Oct. 5
- Absentee voting deadline: Nov. 6
- Online registration: Yes
- Same-day registration: Yes
- Voter ID: Non-photo ID required for in-person voting
- Poll times: 7:00 a.m. to 7:00 p.m.
2022 →
← 2014
|
| Colorado Secretary of State |
|---|
| Democratic primary Republican primary General election |
| Election details |
| Filing deadline: March 20, 2018 |
| Primary: June 26, 2018 General: November 6, 2018 Pre-election incumbent(s): Wayne W. Williams (Republican) |
| How to vote |
| Poll times: 7 a.m. to 7 p.m. Voting in Colorado |
| Ballotpedia analysis |
| Federal and state primary competitiveness State executive elections in 2018 Impact of term limits in 2018 State government trifectas State government triplexes Ballotpedia's Election Analysis Hub, 2018 |
| Colorado executive elections |
| Governor Lieutenant governor |
Jena Griswold (D) defeated incumbent Wayne Williams (R), Amanda Campbell (American Constitution), and Blake Huber (Approval Voting) in the 2018 general election for Colorado Secretary of State.
Williams was first elected in 2014 by a margin of 2 percentage points. The Republican candidate had won each of the ten preceding secretary of state elections. In 2016, Hillary Clinton (D) carried the state by a margin of 5 percentage points.
Griswold's victory, alongside Jared Polis' (D) victory in the gubernatorial election and Phil Weiser's (D) victory in the attorney general election, created a Democratic triplex in Colorado. At the time of the election, neither party had held a triplex in Colorado since Gov. Bill Ritter (D) took office in 2007, breaking a Republican triplex.
Among the office's duties are management and oversight of the state's elections and voter registration, registration of businesses, nonprofits, and political lobbyists, and administration of the Uniform Commercial Code.
![]() For more information about the Democratic primary, click here.
For more information about the Democratic primary, click here.
![]() For more information about the Republican primary, click here.
For more information about the Republican primary, click here.
Candidates and election results[edit]
General election
General election for Colorado Secretary of State
Jena Griswold defeated incumbent Wayne W. Williams, Amanda Campbell, and Blake Huber in the general election for Colorado Secretary of State on November 6, 2018.
Candidate | % | Votes | ||
| ✔ |  | Jena Griswold (D) | 52.7 | 1,313,716 |
 | Wayne W. Williams (R) | 44.7 | 1,113,927 | |
| Amanda Campbell (American Constitution Party) | 2.1 | 51,734 | ||
 | Blake Huber (Approval Voting Party) | 0.5 | 13,258 | |

| Total votes: 2,492,635 | |||
| If you are a candidate and would like to tell readers and voters more about why they should vote for you, complete the Ballotpedia Candidate Connection Survey. | ||||
Do you want a spreadsheet of this type of data? Contact our sales team. | ||||
Withdrawn or disqualified candidates
- Bennett Rutledge (L)
Democratic primary election
Democratic primary for Colorado Secretary of State
Jena Griswold advanced from the Democratic primary for Colorado Secretary of State on June 26, 2018.
Candidate | % | Votes | ||
| ✔ | | Jena Griswold | 100.0 | 510,903 |
| Total votes: 510,903 | |||
| If you are a candidate and would like to tell readers and voters more about why they should vote for you, complete the Ballotpedia Candidate Connection Survey. | ||||
Do you want a spreadsheet of this type of data? Contact our sales team. | ||||
Republican primary election
Republican primary for Colorado Secretary of State
Incumbent Wayne W. Williams advanced from the Republican primary for Colorado Secretary of State on June 26, 2018.
Candidate | % | Votes | ||
| ✔ | | Wayne W. Williams | 100.0 | 414,926 |
| Total votes: 414,926 | |||
| If you are a candidate and would like to tell readers and voters more about why they should vote for you, complete the Ballotpedia Candidate Connection Survey. | ||||
Do you want a spreadsheet of this type of data? Contact our sales team. | ||||
Candidate profiles[edit]

Party: Democratic
Incumbent: No
Political office: None
Biography: Griswold graduated from Whitman College with a degree in politics and Spanish literature in 2006. She obtained her law degree from the University of Pennsylvania in 2011 and worked for two years with the law firm Paul Hastings. In 2013, Griswold was hired as director of Gov. John Hickenlooper's (D) Washington, D.C. office. She left to found Griswold Strategies, LLC in 2015.
- Griswold said that she was running to protect the integrity of the democratic process, saying that "our democracy is under attack, whether from Russian cyberattacks on our elections or from our own president himself."[3]
- Griswold stated that she would make elections more fair by enacting transparency requirements for satellite spending and by modifying the state's redistricting procedures.[3]
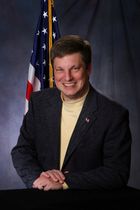
Party: Republican
Incumbent: Yes
Political office: Colorado Secretary of State (Assumed office: 2015), El Paso County Clerk (2011-2014), El Paso County Commission (2003-2011)
Biography: Williams graduated from Brigham Young University with a degree in political science in 1986 and obtained his law degree from the University of Virginia in 1989. After working with two other law firms, Williams founded his own practice in 1998. As of the 2018 election, Williams was owner of his practice.
- Williams said that he was the only candidate who has experience with administering elections, pointing to both his first term as secretary and his four years as El Paso County clerk.[4]
- Williams said that he had a business-friendly record, saying that under his tenure, "since becoming Secretary of State, Colorado has added over 100,000 businesses."[4]
- Williams stated that he had a record of working with both Democrats and Republicans, adding that his opponents "might aim to turn the Colorado Secretary of State’s office into a hyper-partisan office that only seeks to serve one political party or agenda."[4]
Polls[edit]
- See also: Ballotpedia's approach to covering polls
If you are aware of polls conducted in this race, please email us.
Campaign finance[edit]
The chart below contains data from financial reports submitted to the Colorado Secretary of State with information on all raising and spending between the beginning of the election cycle on December 5, 2014, and September 26, 2018.
Noteworthy endorsements[edit]
This section lists noteworthy endorsements issued in this election, including those made by high-profile individuals and organizations, cross-party endorsements, and endorsements made by newspaper editorial boards. It also includes a bulleted list of links to official lists of endorsements for any candidates who published that information on their campaign websites. Please note that this list is not exhaustive. If you are aware of endorsements that should be included, please click here.
Click the links below to see endorsement lists published on candidate campaign websites, if available:
| Noteworthy general election endorsements | ||||||
|---|---|---|---|---|---|---|
| Endorsement | Griswold (D) | Williams (R) | ||||
| Newspapers and editorials | ||||||
| The Aspen Times[5] | ✔ | |||||
| The Aurora Sentinel[6] | ✔ | |||||
| The Coloradoan[7] | ✔ | |||||
| The Durango Herald[8] | ✔ | |||||
| The Gazette[9] | ✔ | |||||
| The Greeley Tribune[10] | ✔ | |||||
| The Pueblo Chieftain[11] | ✔ | |||||
| Elected officials | ||||||
| Former President Barack Obama (D)[12] | ✔ | |||||
| Former Vice President Joe Biden (D)[13] | ✔ | |||||
Timeline[edit]
- October 31, 2018: The Durango Herald endorsed Williams.
- October 30, 2018: The Aspen Times endorsed Williams.
- October 30, 2018: The Gazette endorsed Williams.
- October 28, 2018: The Coloradoan endorsed Williams.
- October 27, 2018: The Greeley Tribune endorsed Williams.
- October 9, 2018: The Aurora Sentinel endorsed Williams.
- October 1, 2018: The Pueblo Chieftain endorsed Williams.
- August 8, 2018: Former President Barack Obama (D) endorsed Griswold.
- June 19, 2018: Former Vice President Joe Biden (D) endorsed Griswold.
Campaign advertisements[edit]
This section shows advertisements released in this race. Ads released by campaigns and, if applicable, satellite groups are embedded or linked below. If you are aware of advertisements that should be included, please email us.
Campaign themes[edit]
 Jena Griswold[edit]
Griswold's campaign website stated the following:
| “ |
Voting Rights The Secretary of State should make elections more accessible and secure. Jena will work to increase voter participation and turnout. That’s why Jena plans to expand automatic voter registration. On the other hand, Jena’s opponent has opposed laws to increase voter participation, such as universal mail ballots and same-day voter registration. Jena will protect Coloradans’ right to vote. Donald Trump set up a federal voter commission to discourage eligible citizens from voting. As Secretary of State, Jena Griswold will stand up to Donald Trump and protect every Coloradan’s right to vote in secure elections. Cyber Security We have great cyber and IT resources in Colorado. As SOS, Jena plans to work with the top minds in government and private sector cyber experts to ensure that we are ready for 21st century challenges. Small Businesses & Entrepreneurs Campaign Finance Jena Griswold plans to close lobbyist loopholes and stop dark money, which is unreported, secret political spending. She will also make sure campaign finance law is enforced and make sure special interest groups and politicians play by the rules.[14] |
” |
| —Jena Griswold for Colorado[15] | ||
 Wayne Williams[edit]
Williams' campaign website stated the following:
| “ |
Independent Principled Leadership Safe and Fair Elections Business Development and Charitable Giving Innovation and Cybersecurity
|
” |
| —Wayne Williams for Colorado[16] | ||
Social media[edit]
Twitter accounts[edit]
Facebook accounts[edit]
Click the icons below to visit the candidates' Facebook pages.
![]() Jena Griswold
Jena Griswold 
![]() Wayne Williams
Wayne Williams
Pivot Counties[edit]
- See also: Pivot Counties by state
Four of 64 Colorado counties—6 percent—are Pivot Counties. Pivot Counties are counties that voted for Barack Obama (D) in 2008 and 2012 and for Donald Trump (R) in 2016. Altogether, the nation had 206 Pivot Counties, with most being concentrated in upper midwestern and northeastern states.
| Counties won by Trump in 2016 and Obama in 2012 and 2008 | |||||||
|---|---|---|---|---|---|---|---|
| County | Trump margin of victory in 2016 | Obama margin of victory in 2012 | Obama margin of victory in 2008 | ||||
| Conejos County, Colorado | 3.56% | 9.22% | 12.93% | ||||
| Huerfano County, Colorado | 6.61% | 8.27% | 11.23% | ||||
| Las Animas County, Colorado | 15.60% | 2.65% | 7.04% | ||||
| Pueblo County, Colorado | 0.50% | 13.99% | 14.97% | ||||
In the 2016 presidential election, Hillary Clinton (D) won Colorado with 48.2 percent of the vote. Donald Trump (R) received 43.3 percent. In presidential elections between 1900 and 2016, Colorado voted Republican 63.3 percent of the time and Democratic 36.7 percent of the time. Colorado voted Republican in the 2000 and 2004 presidential elections, but voted Democratic in the 2008, 2012, and 2016 elections.
Presidential results by legislative district[edit]
The following table details results of the 2012 and 2016 presidential elections by state House districts in Colorado. Click [show] to expand the table. The "Obama," "Romney," "Clinton," and "Trump" columns describe the percent of the vote each presidential candidate received in the district. The "2012 Margin" and "2016 Margin" columns describe the margin of victory between the two presidential candidates in those years. The "Party Control" column notes which party held that seat heading into the 2018 general election. Data on the results of the 2012 and 2016 presidential elections broken down by state legislative districts was compiled by Daily Kos.[17][18]
| In 2012, Barack Obama (D) won 37 out of 65 state House districts in Colorado with an average margin of victory of 27.3 points. In 2016, Hillary Clinton (D) won 40 out of 65 state House districts in Colorado with an average margin of victory of 24.8 points. Clinton won four districts controlled by Republicans heading into the 2018 elections. |
| In 2012, Mitt Romney (R) won 28 out of 65 state House districts in Colorado with an average margin of victory of 21.2 points. In 2016, Donald Trump (R) won 25 out of 65 state House districts in Colorado with an average margin of victory of 25.8 points. Trump won one district controlled by a Democrat heading into the 2018 elections. |
| 2016 presidential results by state House district | |||||||
|---|---|---|---|---|---|---|---|
| District | Obama | Romney | 2012 Margin | Clinton | Trump | 2016 Margin | Party Control |
| 1 | 63.79% | 34.04% | D+29.8 | 59.82% | 32.28% | D+27.5 | D |
| 2 | 72.48% | 24.78% | D+47.7 | 75.22% | 16.32% | D+58.9 | D |
| 3 | 52.36% | 45.33% | D+7 | 53.90% | 37.16% | D+16.7 | D |
| 4 | 79.17% | 18.39% | D+60.8 | 76.84% | 15.60% | D+61.2 | D |
| 5 | 76.41% | 21.06% | D+55.3 | 74.82% | 16.97% | D+57.9 | D |
| 6 | 66.55% | 31.98% | D+34.6 | 70.34% | 23.22% | D+47.1 | D |
| 7 | 82.54% | 16.11% | D+66.4 | 79.82% | 14.64% | D+65.2 | D |
| 8 | 84.00% | 13.75% | D+70.2 | 83.59% | 9.56% | D+74 | D |
| 9 | 63.82% | 33.80% | D+30 | 64.82% | 26.84% | D+38 | D |
| 10 | 79.29% | 17.98% | D+61.3 | 80.62% | 12.47% | D+68.2 | D |
| 11 | 58.66% | 38.84% | D+19.8 | 58.25% | 33.00% | D+25.3 | D |
| 12 | 65.33% | 32.47% | D+32.9 | 66.50% | 25.52% | D+41 | D |
| 13 | 68.88% | 28.33% | D+40.5 | 66.61% | 25.99% | D+40.6 | D |
| 14 | 29.31% | 68.47% | R+39.2 | 28.41% | 61.02% | R+32.6 | R |
| 15 | 35.17% | 62.29% | R+27.1 | 30.23% | 59.27% | R+29 | R |
| 16 | 38.44% | 58.69% | R+20.3 | 33.98% | 55.52% | R+21.5 | R |
| 17 | 58.28% | 38.66% | D+19.6 | 46.07% | 43.39% | D+2.7 | D |
| 18 | 55.69% | 41.03% | D+14.7 | 50.76% | 39.01% | D+11.8 | D |
| 19 | 23.20% | 74.75% | R+51.5 | 21.00% | 70.64% | R+49.6 | R |
| 20 | 36.90% | 61.07% | R+24.2 | 36.13% | 54.67% | R+18.5 | R |
| 21 | 44.76% | 52.44% | R+7.7 | 33.08% | 56.35% | R+23.3 | R |
| 22 | 43.22% | 54.92% | R+11.7 | 41.43% | 49.83% | R+8.4 | R |
| 23 | 56.59% | 40.48% | D+16.1 | 53.37% | 37.35% | D+16 | D |
| 24 | 56.97% | 40.27% | D+16.7 | 54.87% | 35.95% | D+18.9 | D |
| 25 | 45.68% | 52.27% | R+6.6 | 46.55% | 44.77% | D+1.8 | R |
| 26 | 56.52% | 41.35% | D+15.2 | 55.34% | 36.27% | D+19.1 | D |
| 27 | 47.59% | 50.20% | R+2.6 | 45.58% | 45.51% | D+0.1 | R |
| 28 | 56.14% | 41.40% | D+14.7 | 52.88% | 38.13% | D+14.7 | D |
| 29 | 55.15% | 41.90% | D+13.3 | 49.23% | 40.65% | D+8.6 | D |
| 30 | 58.12% | 39.53% | D+18.6 | 50.98% | 40.69% | D+10.3 | D |
| 31 | 57.57% | 39.68% | D+17.9 | 49.47% | 41.26% | D+8.2 | D |
| 32 | 68.41% | 28.79% | D+39.6 | 59.50% | 32.00% | D+27.5 | D |
| 33 | 54.04% | 43.63% | D+10.4 | 54.79% | 35.90% | D+18.9 | D |
| 34 | 58.24% | 38.92% | D+19.3 | 50.21% | 40.46% | D+9.8 | D |
| 35 | 56.93% | 40.57% | D+16.4 | 53.11% | 37.98% | D+15.1 | D |
| 36 | 58.93% | 39.04% | D+19.9 | 53.58% | 37.59% | D+16 | D |
| 37 | 46.74% | 51.56% | R+4.8 | 48.68% | 42.60% | D+6.1 | R |
| 38 | 45.32% | 52.68% | R+7.4 | 46.96% | 43.84% | D+3.1 | R |
| 39 | 33.46% | 64.72% | R+31.3 | 31.36% | 61.02% | R+29.7 | R |
| 40 | 57.39% | 40.16% | D+17.2 | 53.06% | 37.39% | D+15.7 | D |
| 41 | 62.83% | 34.95% | D+27.9 | 60.91% | 31.42% | D+29.5 | D |
| 42 | 72.27% | 25.31% | D+47 | 66.99% | 25.31% | D+41.7 | D |
| 43 | 40.49% | 58.15% | R+17.7 | 42.44% | 48.85% | R+6.4 | R |
| 44 | 37.59% | 60.64% | R+23 | 37.16% | 53.68% | R+16.5 | R |
| 45 | 32.91% | 65.51% | R+32.6 | 32.80% | 58.30% | R+25.5 | R |
| 46 | 55.76% | 42.01% | D+13.8 | 45.78% | 46.05% | R+0.3 | D |
| 47 | 47.31% | 50.40% | R+3.1 | 37.98% | 54.19% | R+16.2 | R |
| 48 | 37.53% | 60.27% | R+22.7 | 30.35% | 61.19% | R+30.8 | R |
| 49 | 41.56% | 56.12% | R+14.6 | 36.54% | 54.81% | R+18.3 | R |
| 50 | 55.50% | 41.23% | D+14.3 | 45.81% | 43.71% | D+2.1 | D |
| 51 | 43.13% | 54.07% | R+10.9 | 36.83% | 53.48% | R+16.7 | R |
| 52 | 57.53% | 39.81% | D+17.7 | 55.70% | 34.08% | D+21.6 | D |
| 53 | 61.38% | 35.23% | D+26.1 | 59.03% | 29.59% | D+29.4 | D |
| 54 | 28.39% | 69.43% | R+41 | 22.69% | 70.10% | R+47.4 | R |
| 55 | 36.10% | 61.61% | R+25.5 | 32.32% | 59.26% | R+26.9 | R |
| 56 | 40.95% | 56.94% | R+16 | 36.37% | 55.99% | R+19.6 | R |
| 57 | 38.90% | 58.78% | R+19.9 | 34.52% | 58.25% | R+23.7 | R |
| 58 | 36.91% | 60.52% | R+23.6 | 31.94% | 61.10% | R+29.2 | R |
| 59 | 50.62% | 46.33% | D+4.3 | 47.02% | 43.47% | D+3.5 | D |
| 60 | 39.26% | 57.98% | R+18.7 | 31.71% | 60.43% | R+28.7 | R |
| 61 | 55.13% | 42.35% | D+12.8 | 52.90% | 39.28% | D+13.6 | D |
| 62 | 58.86% | 38.59% | D+20.3 | 47.77% | 43.64% | D+4.1 | D |
| 63 | 40.61% | 56.65% | R+16 | 33.06% | 58.29% | R+25.2 | R |
| 64 | 31.01% | 66.64% | R+35.6 | 22.78% | 70.74% | R+48 | R |
| 65 | 29.29% | 68.33% | R+39 | 20.30% | 74.27% | R+54 | R |
| Total | 51.49% | 46.13% | D+5.4 | 48.16% | 43.25% | D+4.9 | - |
| Source: Daily Kos | |||||||
Election history[edit]
2014[edit]
In the 2014 secretary of state election, Wayne Williams (R) defeated Joe Neguse (D).
| Secretary of State of Colorado, 2014 | ||||
|---|---|---|---|---|
| Party | Candidate | Vote % | Votes | |
| Republican | 47.3% | 932,588 | ||
| Democratic | Joe Neguse | 45% | 886,043 | |
| American Constitution | Amanda Campbell | 3.9% | 77,790 | |
| Libertarian | David Schambach | 3.7% | 73,413 | |
| Total Votes | 1,969,834 | |||
| Election results via Colorado Secretary of State | ||||
State overview[edit]
Partisan control[edit]
This section details the partisan control of federal and state positions in Colorado heading into the 2018 elections.
Congressional delegation[edit]
- The state had a split delegation (one Democrat, one Republican) in the U.S. Senate. Colorado did not hold elections for either U.S. Senate seat in 2018.
- Republicans held four of seven U.S. House seats in Colorado, and Democrats held three.
State executives[edit]
- As of May 2018, Republicans held three of 10 state executive positions. Democrats held two, and five were nonpartisan.
- The governor of Colorado was Democrat John Hickenlooper, who was term-limited and unable to run for re-election in 2018. The state held elections for governor and lieutenant governor on November 6, 2018.
State legislature[edit]
- The Colorado state legislature was under divided control. Republicans had an 18-16 majority in the state Senate, with one Independent who caucused with the Democrats. Democrats had a 36-29 majority in the state House.
Trifecta status[edit]
- Heading into the 2018 elections, Colorado was under divided government.
2018 elections[edit]
- See also: Colorado elections, 2018
Colorado held elections for the following positions in 2018:
- All seven U.S. House seats
- Governor and lieutenant governor
- Attorney general
- Secretary of state
- Treasurer
- Seventeen of 35 seats in the state Senate
- All 65 seats in the state House of Representatives
- Two of seven seats on the state board of education
- Three of nine seats on the state board of regents
- One justice of the Colorado Supreme Court (retention election)
- Five members of the Colorado Court of Appeals (retention election)
- Local judicial offices
- Municipal elections in Adams County, Arapahoe County and El Paso County
Demographics[edit]
| Demographic data for Colorado | ||
|---|---|---|
| Colorado | U.S. | |
| Total population: | 5,448,819 | 316,515,021 |
| Land area (sq mi): | 103,642 | 3,531,905 |
| Race and ethnicity** | ||
| White: | 84.2% | 73.6% |
| Black/African American: | 4% | 12.6% |
| Asian: | 2.9% | 5.1% |
| Native American: | 0.9% | 0.8% |
| Pacific Islander: | 0.1% | 0.2% |
| Two or more: | 3.5% | 3% |
| Hispanic/Latino: | 21.1% | 17.1% |
| Education | ||
| High school graduation rate: | 90.7% | 86.7% |
| College graduation rate: | 38.1% | 29.8% |
| Income | ||
| Median household income: | $60,629 | $53,889 |
| Persons below poverty level: | 13.5% | 11.3% |
| Source: U.S. Census Bureau, "American Community Survey" (5-year estimates 2010-2015) Click here for more information on the 2020 census and here for more on its impact on the redistricting process in Colorado. **Note: Percentages for race and ethnicity may add up to more than 100 percent because respondents may report more than one race and the Hispanic/Latino ethnicity may be selected in conjunction with any race. Read more about race and ethnicity in the census here. | ||
As of July 2017, Colorado had a population of approximately 5.6 million people, and its two largest cities were Denver (pop. est. 719,000) and Colorado Springs (pop. est. 484,000).[19][20]
State election history[edit]
This section provides an overview of federal and state elections in Colorado from 2000 to 2016.
Historical elections[edit]
Presidential elections, 2000-2016[edit]
This chart shows the results of the presidential election in Colorado every year from 2000 to 2016.
| Election results (President of the United States), Colorado 2000-2016[21] | |||||
|---|---|---|---|---|---|
| Year | First-place candidate | First-place candidate votes (%) | Second-place candidate | Second-place candidate votes (%) | Margin of victory (%) |
| 2016 | 48.2% | 43.3% | 4.9% | ||
| 2012 | 51.5% | 46.1% | 5.4% | ||
| 2008 | 53.7% | 44.7% | 9.0% | ||
| 2004 | 51.7% | 47.0% | 4.7% | ||
| 2000 | 50.8% | 42.4% | 8.4% | ||
U.S. Senate elections, 2000-2016[edit]
This chart shows the results of U.S. Senate races in Colorado from 2000 to 2016. Every state has two Senate seats, and each seat goes up for election every six years. The terms of the seats are staggered so that roughly one-third of the seats are up every two years.
| Election results (U.S. Senator), Colorado 2000-2016 | |||||
|---|---|---|---|---|---|
| Year | First-place candidate | First-place candidate votes (%) | Second-place candidate | Second-place candidate votes (%) | Margin of victory (%) |
| 2016[22] | 50.0% | 44.3% | 5.7% | ||
| 2014[23] | 48.2% | 46.3% | 1.9% | ||
| 2010[24] | 48.1% | 46.4% | 1.7% | ||
| 2008[25] | 52.8% | 42.5% | 10.3% | ||
| 2004[26] | 50.4% | 45.7% | 4.7% | ||
| 2002[27] | 50.1% | 45.2% | 4.9% | ||
Gubernatorial elections, 2000-2016[edit]
This chart shows the results of the four gubernatorial elections held between 2000 and 2016. Gubernatorial elections are held every four years in Colorado, and take place in even-numbered years between presidential elections.
| Election results (Governor), Colorado 2000-2016 | |||||
|---|---|---|---|---|---|
| Year | First-place candidate | First-place candidate votes (%) | Second-place candidate | Second-place candidate votes (%) | Margin of victory (%) |
| 2014[23] | 49.3% | 46.0% | 3.3% | ||
| 2010[24] | 51.1% | 36.4% | 14.7% | ||
| 2006[28] | 56.0% | 39.5% | 16.5% | ||
| 2002[27] | 61.7% | 33.2% | 28.5% | ||
Congressional delegation, 2000-2016[edit]
This chart shows the number of Democrats and Republicans who were elected to represent Colorado in the U.S. House from 2000 to 2016. Elections for U.S. House seats are held every two years.
| Congressional delegation, Colorado 2000-2016 | |||||
|---|---|---|---|---|---|
| Year | Republicans | Republicans (%) | Democrats | Democrats (%) | Balance of power |
| 2016[22] | 57.1% | 42.9% | R+1 | ||
| 2014[23] | 57.1% | 42.9% | R+1 | ||
| 2012[29] | 57.1% | 42.9% | R+1 | ||
| 2010[24] | 57.1% | 42.9% | R+1 | ||
| 2008[25] | 28.6% | 71.4% | D+3 | ||
| 2006[28] | 42.9% | 57.1% | D+1 | ||
| 2004[26] | 57.1% | 42.9% | R+1 | ||
| 2002[27] | 71.4% | 28.6% | R+3 | ||
| 2000[30] | 66.7% | 33.3% | R+2 | ||
Trifectas, 1992-2018[edit]
A state government trifecta occurs when one party controls both chambers of the state legislature and the governor's office.
Colorado Party Control: 1992-2026
Fourteen years of Democratic trifectas • Four years of Republican trifectas
Scroll left and right on the table below to view more years.
| Year | 92 | 93 | 94 | 95 | 96 | 97 | 98 | 99 | 00 | 01 | 02 | 03 | 04 | 05 | 06 | 07 | 08 | 09 | 10 | 11 | 12 | 13 | 14 | 15 | 16 | 17 | 18 | 19 | 20 | 21 | 22 | 23 | 24 | 25 | 26 |
|---|---|---|---|---|---|---|---|---|---|---|---|---|---|---|---|---|---|---|---|---|---|---|---|---|---|---|---|---|---|---|---|---|---|---|---|
| Governor | D | D | D | D | D | D | D | R | R | R | R | R | R | R | R | D | D | D | D | D | D | D | D | D | D | D | D | D | D | D | D | D | D | D | D |
| Senate | R | R | R | R | R | R | R | R | R | D | D | R | R | D | D | D | D | D | D | D | D | D | D | R | R | R | R | D | D | D | D | D | D | D | D |
| House | R | R | R | R | R | R | R | R | R | R | R | R | R | D | D | D | D | D | D | R | R | D | D | D | D | D | D | D | D | D | D | D | D | D | D |
Recent news[edit]
The link below is to the most recent stories in a Google news search for the terms Colorado secretary of state election 2018. These results are automatically generated from Google. Ballotpedia does not curate or endorse these articles.
See also[edit]
|
Colorado government: |
Elections: |
Ballotpedia exclusives: |
External links[edit]
Footnotes[edit]
- ↑ Same-day registration was available for those voting in person at Voter Service and Polling Centers,
- ↑ Same-day registration was available for those voting in person at Voter Service and Polling Centers,
- ↑ 3.0 3.1 Youtube, "Why I am running," accessed October 2, 2018
- ↑ 4.0 4.1 4.2 Wayne Williams for Colorado Secretary of State, "Experience Matters: The Williams Record," accessed October 2, 2018
- ↑ The Aspen Times, "Aspen Times Editorial: Breaking down the Colorado races," October 30, 2018
- ↑ The Aurora Sentinel, "ENDORSEMENT: Williams deserves your vote of confidence as Colorado secretary of state," October 9, 2018
- ↑ Coloradoan, "Coloradoan editorial board endorsement: Williams has earned trust as secretary of state," October 28, 2018
- ↑ The Durango Herald, "Ignore the wave, support Wayne Williams," October 31, 2018
- ↑ The Gazette, "EDITORIAL: Keep Wayne Williams, a proven success, as secretary of state," October 30, 2018
- ↑ The Greeley Tribune, "Tribune Endorsement: Wayne Williams deserves another term as Colorado’s secretary of state," October 27, 2018
- ↑ The Pueblo Chieftain, "Williams for secretary of state," October 1, 2018
- ↑ Chicago Sun-Times, "Obama jumps into mid-terms; endorses Pritzker, Raoul, Casten, Kelly, Underwood," August 2, 2018
- ↑ 9 News, "Joe Biden throws weight behind secretary of state hopeful Jena Griswold," June 19, 2018
- ↑ 14.0 14.1 Note: This text is quoted verbatim from the original source. Any inconsistencies are attributable to the original source.
- ↑ Jena for Colorado, "Issues and Solutions," accessed October 2, 2018
- ↑ Wayne Williams for Colorado, "Home," accessed October 2, 2018
- ↑ Daily Kos, "Daily Kos Elections' statewide election results by congressional and legislative districts," July 9, 2013
- ↑ Daily Kos, "Daily Kos Elections' 2016 presidential results for congressional and legislative districts," February 6, 2017
- ↑ United States Census Bureau, "QuickFacts Colorado," accessed April 2, 2018
- ↑ World Population Review, "Population of Cities in Colorado (2018)," accessed April 2, 2018
- ↑ US Election Atlas, "United States Presidential Election Results," accessed April 2, 2018
- ↑ 22.0 22.1 Colorado Secretary of State, "2016 Abstract of Votes Cast," accessed April 3, 2018
- ↑ 23.0 23.1 23.2 Colorado Secretary of State, "2014 Abstract of Votes Cast," accessed April 3, 2018
- ↑ 24.0 24.1 24.2 Colorado Secretary of State, "2010 Abstract of Votes Cast," accessed April 4, 2018
- ↑ 25.0 25.1 Colorado Secretary of State, "Official Publication of the Abstract of Votes Cast for the 2008 Primary & 2008 General," accessed April 4, 2018
- ↑ 26.0 26.1 Colorado Secretary of State, "Official Publication of the Abstract of Votes Cast for the 2003 Coordinated, 2004 Primary, & 2004 General," accessed April 4, 2018
- ↑ 27.0 27.1 27.2 Colorado Secretary of State, "Official Publication of the Abstract of Votes Cast for the 2001 Coordinated, 2002 Primary, & 2002 General," accessed April 4, 2018
- ↑ 28.0 28.1 Colorado Secretary of State, "Official Publication of the Abstract of Votes Cast for the 2005 Coordinated, 2006 Primary, & 2006 General," accessed April 4, 2018
- ↑ Colorado Secretary of State, "2012 Abstract of Votes Cast," accessed April 4, 2018
- ↑ Colorado Secretary of State, "Official Publication of the Abstract of Votes Cast for the 2000 Presidential, 2000 Primary, & 2000 General," accessed April 4, 2018

 EncycloReader
is supported by the
EncycloReader
is supported by the