Hillsborough County Public Schools, Florida
 From Ballotpedia - Reading time: 7 min
| Hillsborough County Public Schools |
|---|
| Tampa, Florida |
| District details |
| Superintendent: Addison Davis |
| # of school board members: 7 |
| Website: Link |
Hillsborough County Public Schools is a school district in Florida.
Click on the links below to learn more about the school district's...
- Superintendent
- School board
- Elections
- Budget
- Teacher salaries
- Academic performance
- Student enrollment
- Demographics
- Contact information
Contents
Superintendent[edit]
| |
This information is updated as we become aware of changes. Please contact us with any updates. |
Addison Davis is the superintendent of Hillsborough County Public Schools. Davis was appointed superintendent in March 2020. Davis' previous career experience includes working as the superintendent for Clay County Schools and the chief of schools for the Duval County Public Schools. He has also worked as a teacher, assistant principal, and principal.[1]
Past superintendents[edit]
- Jeff Eakins was the superintendent of Hillsborough County Public Schools from 2015 to 2020. Eakins was appointed superintendent on July 1, 2015. Eakins' previous career experience includes working as a teacher, principal, and deputy superintendent.[2]
School board elections[edit]
The Hillsborough County Public Schools Board of Education consists of seven members elected to four-year terms. Members from Districts 1 through 5 are elected by district, and members from Districts 6 and 7 are elected at large.[3]
| |
This officeholder information was last updated on August 4, 2021. Please contact us with any updates. | |
Election dates[edit]
Elections are held on a staggered basis in the November general election.[4]
A primary election was scheduled for August 18, 2020. A general election was scheduled for November 3, 2020.
Public participation in board meetings[edit]
The Hillsborough County Public Schools school board maintains the following policy on public testimony during board meetings:[5]
| “ |
Public Participation at Board Meetings
The School Board recognizes the value of public comment on educational, financial, administrative, and other issues related to the Board's work.
The Board therefore provides a period for public participation at each public meeting of the Board and publishes rules to govern such participation in Board meetings.
The presiding officer of the meeting shall administer the Board's rules for that participation.
No Board action shall be taken on requests made during public discussion unless the Board declares the matter to be an emergency in accordance with current law. Other issues shall be placed on the agenda for a subsequent meeting.[6] |
” |
Budget[edit]
From 1993 to 2013, the Hillsborough County school district had an average of $1,350,910,286 in revenue and $1,384,357,048 in expenditures, according to the United States Census Bureau's survey of school system finances. The district had a yearly average of $798,151,810 in outstanding debt. The district retired $28,563,476 of its debt and issued $106,764,619 in new debt each year on average.[7]
Revenue[edit]
The table below separates the district's revenue into the three sources identified by the agency: local, state, and federal.
| Revenue by Source | |||||||||||
|---|---|---|---|---|---|---|---|---|---|---|---|
| Fiscal Year |
Local | State | Federal | Revenue Total | |||||||
| Total | % of Revenue | Total | % of Revenue | Total | % of Revenue | ||||||
| Click [show] on the right to display the revenue data for prior years. | |||||||||||
|---|---|---|---|---|---|---|---|---|---|---|---|
| 1993 | $ | 0.00% | $ | 0.00% | $ | 0.00% | $ | ||||
| 1994 | $254,554,000 | 34.14% | $409,583,000 | 54.92% | $81,581,000 | 10.94% | $745,718,000 | ||||
| 1995 | $277,264,000 | 34.23% | $455,171,000 | 56.20% | $77,539,000 | 9.57% | $809,974,000 | ||||
| 1996 | $308,385,000 | 34.80% | $496,803,000 | 56.07% | $80,868,000 | 9.13% | $886,056,000 | ||||
| 1997 | $312,607,000 | 35.26% | $491,095,000 | 55.40% | $82,781,000 | 9.34% | $886,483,000 | ||||
| 1998 | $325,935,000 | 34.14% | $540,066,000 | 56.57% | $88,661,000 | 9.29% | $954,662,000 | ||||
| 1999 | $354,939,000 | 33.60% | $604,771,000 | 57.25% | $96,580,000 | 9.14% | $1,056,290,000 | ||||
| 2000 | $386,142,000 | 33.87% | $638,421,000 | 56.00% | $115,426,000 | 10.13% | $1,139,989,000 | ||||
| 2001 | $411,352,000 | 33.37% | $685,543,000 | 55.61% | $135,982,000 | 11.03% | $1,232,877,000 | ||||
| 2002 | $433,570,000 | 33.98% | $691,324,000 | 54.17% | $151,250,000 | 11.85% | $1,276,144,000 | ||||
| 2003 | $470,380,000 | 36.10% | $663,797,000 | 50.95% | $168,645,000 | 12.94% | $1,302,822,000 | ||||
| 2004 | $502,784,000 | 35.96% | $702,746,000 | 50.26% | $192,811,000 | 13.79% | $1,398,341,000 | ||||
| 2005 | $530,531,000 | 33.58% | $842,093,000 | 53.30% | $207,334,000 | 13.12% | $1,579,958,000 | ||||
| 2006 | $567,183,000 | 35.67% | $800,252,000 | 50.33% | $222,703,000 | 14.01% | $1,590,138,000 | ||||
| 2007 | $633,956,000 | 35.86% | $886,776,000 | 50.17% | $246,951,000 | 13.97% | $1,767,683,000 | ||||
| 2008 | $751,378,000 | 35.28% | $1,125,993,000 | 52.87% | $252,566,000 | 11.86% | $2,129,937,000 | ||||
| 2009 | $787,300,000 | 38.06% | $1,034,236,000 | 50.00% | $247,129,000 | 11.95% | $2,068,665,000 | ||||
| 2010 | $783,475,000 | 41.11% | $853,212,000 | 44.77% | $269,224,000 | 14.13% | $1,905,911,000 |
| 2011 | $700,744,000 | 37.16% | $809,690,000 | 42.94% | $375,324,000 | 19.90% | $1,885,758,000 |
| 2012 | $638,603,000 | 32.78% | $885,131,000 | 45.44% | $424,200,000 | 21.78% | $1,947,934,000 |
| 2013 | $664,649,000 | 36.85% | $847,219,000 | 46.97% | $291,908,000 | 16.18% | $1,803,776,000 |
| Avg. | $480,749,095 | 33.61% | $688,758,190 | 49.53% | $181,403,000 | 12.10% | $1,350,910,286 |
Expenditures[edit]
The table below separates the district's expenditures into five categories identified by the agency:
- Instruction: operation expenditures, state payments on behalf of the district for instruction and benefits, and retirement system transfers
- Support Services: support services, food services, and retirement system transfers for support service staff
- Capital Spending: capital outlay expenditures (i.e., construction, land or facilities purchases, and equipment purchases)
- Debt & Gov. Payments: payments to state and local governments and interest on school system debt
- Other: all other non-K-12 programs, except food services
| Expenditures by Category | |||||||||||
|---|---|---|---|---|---|---|---|---|---|---|---|
| Fiscal Year |
Instruction | Support Services | Capital Spending | Debt & Gov. Payments | Other | Budget Total | |||||
| Total | % of Budget | Total | % of Budget | Total | % of Budget | Total | % of Budget | Total | % of Budget | ||
| Click [show] on the right to display the expenditure data for prior years. | |||||||||||
|---|---|---|---|---|---|---|---|---|---|---|---|
| 1993 | $ | 00.00% | $ | 00.00% | $ | 0.00% | $ | 0.00% | $ | 0.00% | $ |
| 1994 | $353,904,000 | 47.42% | $274,906,000 | 36.83% | $79,738,000 | 10.68% | $8,059,000 | 1.08% | $29,739,000 | 3.98% | $746,346,000 |
| 1995 | $391,537,000 | 46.66% | $305,964,000 | 36.46% | $101,450,000 | 12.09% | $10,180,000 | 1.21% | $29,954,000 | 3.57% | $839,085,000 |
| 1996 | $424,198,000 | 45.59% | $323,194,000 | 34.74% | $133,484,000 | 14.35% | $14,537,000 | 1.56% | $34,957,000 | 3.76% | $930,370,000 |
| 1997 | $421,135,000 | 44.55% | $325,927,000 | 34.48% | $141,137,000 | 14.93% | $19,926,000 | 2.11% | $37,194,000 | 3.93% | $945,319,000 |
| 1998 | $437,615,000 | 44.39% | $333,971,000 | 33.88% | $152,589,000 | 15.48% | $22,612,000 | 2.29% | $39,101,000 | 3.97% | $985,888,000 |
| 1999 | $478,260,000 | 45.33% | $359,627,000 | 34.08% | $144,935,000 | 13.74% | $27,729,000 | 2.63% | $44,559,000 | 4.22% | $1,055,110,000 |
| 2000 | $521,255,000 | 47.24% | $394,218,000 | 35.73% | $112,305,000 | 10.18% | $23,825,000 | 2.16% | $51,719,000 | 4.69% | $1,103,322,000 |
| 2001 | $529,551,000 | 44.86% | $397,329,000 | 33.66% | $162,575,000 | 13.77% | $28,451,000 | 2.41% | $62,653,000 | 5.31% | $1,180,559,000 |
| 2002 | $574,129,000 | 43.64% | $420,772,000 | 31.99% | $219,352,000 | 16.67% | $35,267,000 | 2.68% | $65,975,000 | 5.02% | $1,315,495,000 |
| 2003 | $599,185,000 | 42.73% | $430,356,000 | 30.69% | $261,740,000 | 18.67% | $41,537,000 | 2.96% | $69,353,000 | 4.95% | $1,402,171,000 |
| 2004 | $666,667,000 | 44.28% | $458,095,000 | 30.43% | $260,417,000 | 17.30% | $46,187,000 | 3.07% | $74,076,000 | 4.92% | $1,505,442,000 |
| 2005 | $731,870,000 | 45.08% | $482,784,000 | 29.74% | $287,434,000 | 17.70% | $49,307,000 | 3.04% | $72,074,000 | 4.44% | $1,623,469,000 |
| 2006 | $758,382,000 | 45.86% | $506,713,000 | 30.64% | $262,050,000 | 15.85% | $52,271,000 | 3.16% | $74,396,000 | 4.50% | $1,653,812,000 |
| 2007 | $823,943,000 | 45.58% | $545,494,000 | 30.17% | $293,853,000 | 16.25% | $52,364,000 | 2.90% | $92,172,000 | 5.10% | $1,807,826,000 |
| 2008 | $906,631,000 | 47.26% | $599,197,000 | 31.23% | $250,867,000 | 13.08% | $58,366,000 | 3.04% | $103,454,000 | 5.39% | $1,918,515,000 |
| 2009 | $986,010,000 | 46.67% | $627,374,000 | 29.70% | $336,471,000 | 15.93% | $57,856,000 | 2.74% | $104,916,000 | 4.97% | $2,112,627,000 |
| 2010 | $1,014,717,000 | 48.44% | $630,591,000 | 30.10% | $278,919,000 | 13.31% | $59,455,000 | 2.84% | $111,152,000 | 5.31% | $2,094,834,000 |
| 2011 | $992,325,000 | 50.56% | $647,960,000 | 33.01% | $153,716,000 | 7.83% | $57,446,000 | 2.93% | $111,388,000 | 5.67% | $1,962,835,000 |
| 2012 | $1,028,686,000 | 52.17% | $675,528,000 | 34.26% | $105,401,000 | 5.35% | $51,660,000 | 2.62% | $110,468,000 | 5.60% | $1,971,743,000 |
| 2013 | $990,247,000 | 51.66% | $648,821,000 | 33.85% | $117,715,000 | 6.14% | $51,986,000 | 2.71% | $107,961,000 | 5.63% | $1,916,730,000 |
| Avg. | $649,059,381 | 44.28% | $447,086,714 | 31.22% | $183,626,095 | 12.82% | $36,620,048 | 2.39% | $67,964,810 | 4.52% | $1,384,357,048 |
Debt
The table below shows the amount of debt retired, issued, and outstanding in the district for each year.
| Debt | |||
|---|---|---|---|
| Fiscal Year |
Retired | Issued | Outstanding |
| Click [show] on the right to display the debt data for prior years. | |||
|---|---|---|---|
| 1993 | $0 | $0 | $0 |
| 1994 | $9,741,000 | $0 | $112,134,000 |
| 1995 | $10,226,000 | $219,314,000 | $327,432,000 |
| 1996 | $12,097,000 | $73,425,000 | $390,614,000 |
| 1997 | $19,598,000 | $4,951,000 | $375,566,000 |
| 1998 | $18,493,000 | $96,743,000 | $454,791,000 |
| 1999 | $23,102,000 | $404,722,000 | $569,056,000 |
| 2000 | $32,858,000 | $13,618,000 | $549,122,000 |
| 2001 | $28,506,000 | $124,107,000 | $643,944,000 |
| 2002 | $53,486,000 | $151,118,000 | $647,337,000 |
| 2003 | $40,861,000 | $320,372,000 | $926,613,000 |
| 2004 | $30,399,000 | $69,017,000 | $959,977,000 |
| 2005 | $31,958,000 | $165,206,000 | $1,065,183,000 |
| 2006 | $32,038,000 | $143,225,000 | $1,132,539,000 |
| 2007 | $37,933,000 | $147,947,000 | $1,240,997,000 |
| 2008 | $27,878,000 | $163,928,000 | $1,300,381,000 |
| 2009 | $32,075,000 | $5,085,000 | $1,272,639,000 |
| 2010 | $35,023,000 | $0 | $1,236,974,000 |
| 2011 | $36,494,000 | $98,220,000 | $1,199,313,000 |
| 2012 | $37,101,000 | $41,059,000 | $1,203,271,000 |
| 2013 | $49,966,000 | $0 | $1,153,305,000 |
| Avg. | $28,563,476 | $106,764,619 | $798,151,810 |
Teacher salaries[edit]
The following salary information was pulled from the district's teacher salary schedule. A salary schedule is a list of expected compensations based on variables such as position, years employed, and education level. It may not reflect actual teacher salaries in the district.
| Year | Minimum |
|---|---|
| 2020-2021[8] | $46,900.02 |
Academic performance[edit]
Proficiency assessments[edit]
Each year, state and local education agencies use tests and other standards to assess student proficiency. Although the data below was published by the U.S. Department of Education, proficiency measurements are established by the states. As a result, proficiency levels are not comparable between different states and year-over-year proficiency levels within a district may not be comparable because states may change their proficiency measurements.[9]
Mathematics[edit]
The following table shows the percentage of district students who scored at or above the proficiency level each school year:[10]
| School year | All (%) | Asian/Pacific Islander (%) |
Black (%) | Hispanic (%) | Native American (%) |
Two or More Races (%) |
White (%) |
|---|---|---|---|---|---|---|---|
| 2018-2019 | 55 | 86 | 36 | 49 | 55-59 | 63 | 70 |
| 2017-2018 | 55 | 85 | 36 | 48 | 60-64 | 63 | 70 |
| 2016-2017 | 54 | 84 | 35 | 47 | 50-54 | 63 | 69 |
| 2015-2016 | 52 | 82 | 33 | 45 | 55-59 | 60 | 67 |
| 2014-2015 | 53 | 83 | 34 | 45 | 58 | N/A | 66 |
| 2013-2014 | 57 | 86 | 38 | 50 | 61 | N/A | 70 |
| 2012-2013 | 55 | 85 | 36 | 49 | 57 | N/A | 69 |
| 2011-2012 | 54 | 83 | 35 | 47 | 55 | N/A | 67 |
| 2010-2011 | 66 | 89 | 48 | 61 | 68 | N/A | 79 |
Reading/language arts[edit]
The following table shows the percentage of district students who scored at or above the proficiency level each school year:[10]
| School year | All (%) | Asian/Pacific Islander (%) |
Black (%) | Hispanic (%) | Native American (%) |
Two or More Races (%) |
White (%) |
|---|---|---|---|---|---|---|---|
| 2018-2019 | 54 | 80 | 36 | 46 | 55-59 | 64 | 69 |
| 2017-2018 | 53 | 80 | 35 | 44 | 55-59 | 63 | 68 |
| 2016-2017 | 52 | 79 | 34 | 43 | 50-54 | 62 | 68 |
| 2015-2016 | 50 | 77 | 32 | 41 | 55-59 | 60 | 65 |
| 2014-2015 | 51 | 79 | 32 | 43 | 54 | N/A | 66 |
| 2013-2014 | 56 | 80 | 38 | 48 | 57 | N/A | 71 |
| 2012-2013 | 55 | 79 | 36 | 47 | 57 | N/A | 69 |
| 2011-2012 | 55 | 76 | 35 | 47 | 53 | N/A | 69 |
| 2010-2011 | 60 | 79 | 41 | 53 | 59 | N/A | 73 |
Graduation rates[edit]
The following table shows the graduation rate of district students each school year:[10][11]
| School year | All (%) | Asian/Pacific Islander (%) |
Black (%) | Hispanic (%) | Native American (%) |
Two or More Races (%) |
White (%) |
|---|---|---|---|---|---|---|---|
| 2017-2018 | 87 | 96 | 81 | 85 | ≥90 | 88 | 92 |
| 2016-2017 | 83 | 95 | 74 | 80 | 80-89 | 87 | 89 |
| 2015-2016 | 79 | 91 | 69 | 75 | 80-84 | 81 | 86 |
| 2014-2015 | 76 | 91 | 64 | 72 | 60-69 | 84 | 84 |
| 2013-2014 | 73 | 91 | 60 | 68 | 70-79 | N/A | 83 |
| 2012-2013 | 74 | 91 | 59 | 68 | 80-89 | N/A | 84 |
| 2011-2012 | 73 | 90 | 58 | 68 | 70-79 | N/A | 81 |
| 2010-2011 | 69 | 85 | 55 | 64 | 70-79 | N/A | 78 |
Student enrollment[edit]
| Year[12] | Enrollment | Year-to-year change (%) |
|---|---|---|
| 2018-2019 | 220,252 | 1.5 |
| 2017-2018 | 217,072 | 1.3 |
| 2016-2017 | 214,386 | 1.2 |
| 2015-2016 | 211,923 | 2.1 |
| 2014-2015 | 207,469 | 2.0 |
| 2013-2014 | 203,439 | 1.5 |
| 2012-2013 | 200,466 | 1.7 |
| 2011-2012 | 197,041 | 1.3 |
| 2010-2011 | 194,525 | 0.7 |
| 2009-2010 | 193,265 | 0.7 |
| 2008-2009 | 192,007 | -0.6 |
| 2007-2008 | 193,180 | -0.2 |
| 2006-2007 | 193,517 | -0.1 |
| 2005-2006 | 193,757 | 2.7 |
| 2004-2005 | 188,703 | 4.1 |
| 2003-2004 | 181,298 | 3.6 |
| 2002-2003 | 174,969 | 3.1 |
| 2001-2002 | 169,740 | 3.3 |
| 2000-2001 | 164,270 | 3.0 |
| 1999-2000 | 159,517 | 2.0 |
| 1998-1999 | 156,452 | 2.4 |
| 1997-1998 | 152,758 | 3.3 |
| 1996-1997 | 147,826 | 3.2 |
| 1995-1996 | 143,192 | -3.1 |
| 1994-1995 | 147,795 | 9.4 |
| 1993-1994 | 135,104 | 2.2 |
| 1992-1993 | 132,224 | 3.8 |
| 1991-1992 | 127,439 | 2.5 |
| 1990-1991 | 124,337 | 3.8 |
| 1989-1990 | 119,810 | 0.7 |
| 1988-1989 | 119,022 | 0.8 |
| 1987-1988 | 118,031 | 2.4 |
| 1986-1987 | 115,242 | - |
About the district[edit]
Hillsborough County Public Schools is located in Hillsborough County, Florida. It is classified as a large suburban school district by the National Center for Education Statistics. The district served 220,252 students during the 2018-2019 school year and comprised 297 schools.[13]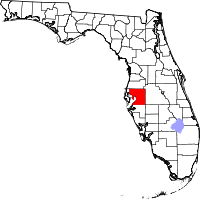
During the 2018-2019 school year, 59.0% of the district's students were eligible for free or reduced-price lunch, 10.7% were English language learners, and 14.4% of students had an Individual Education Plan (IEP).[14]
| Racial Demographics, 2018-2019 | ||
|---|---|---|
| Race | Hillsborough County Public Schools (%) | Florida K-12 students (%) |
| American Indian/Alaska Native | 0.2 | 0.3 |
| Asian or Asian/Pacific Islander | 4.1 | 2.8 |
| Black | 21.0 | 21.9 |
| Hispanic | 37.1 | 33.9 |
| Native Hawaiian/Pacific Islander | 0.2 | 0.2 |
| Two or More Races | 4.6 | 3.6 |
| White | 32.9 | 37.4 |
Note: Percentages for race and ethnicity may add up to more than 100 percent because respondents may report more than one race and the Hispanic/Latino ethnicity may be selected in conjunction with any race. Read more about race and ethnicity in the census here.
Contact information[edit]

Hillsborough County Public Schools
901 E. Kennedy Blvd.
Tampa, FL 33602
Phone: 813-272-4000
See also[edit]
| Florida | School Board Elections | News and Analysis |
|---|---|---|
 |
 | |
|
|
External links[edit]
- Search Google News for this topic
- Hillsborough County Public Schools
- Florida School Boards Association
- Florida Department of Education
Footnotes[edit]
- ↑ Hillsborough County Public Schools, "Superintendent's Office - Meet the Superintendent," accessed April 29, 2021
- ↑ Spectrum News - Bay News 9, "Hillsborough Schools Superintendent Announces Retirement Plans," June 10, 2019
- ↑ Hillsborough County Public Schools, "Policy Manual: Bylaws: 0140 - Membership," accessed August 4, 2021
- ↑ Online Sunshine, "The 2020 Florida Statutes: 1001.35 - Term of office," accessed April 27, 2021
- ↑ Hillsborough County Public Schools, "Policy Manual: 0160 - Meetings," accessed August 4, 2021
- ↑ Note: This text is quoted verbatim from the original source. Any inconsistencies are attributable to the original source.
- ↑ United States Census Bureau, "Public School System Finances: Historical Data," accessed December 1, 2015
- ↑ Hillsborough County Public Schools, "Employee Salary Schedules: 2020-2021," accessed August 4, 2021
- ↑ U.S. Department of Education, Washington, DC: EDFacts, "State Assessments in Reading/Language Arts and Mathematics- School Year 2018-19 EDFacts Data Documentation," accessed February 25, 2021
- ↑ 10.0 10.1 10.2 To protect student privacy, percentages were reported as ranges for groups of 300 students or fewer. If five (5) or fewer students were included in a data set, the data was replaced by "PS."
- ↑ U.S. Department of Education, Washington, DC: EDFacts, "Four-Year Adjusted-Cohort Graduation Rates - School Year 2017-18 EDFacts Data Documentation," accessed February 25, 2021
- ↑ National Center for Education Statistics, "ElSi tableGenerator," accessed March 8, 2021
- ↑ National Center for Education Statistics, "Search for Public School Districts," accessed March 8, 2021
- ↑ National Center for Education Statistics, "Public Elementary/Secondary School Universe Survey," accessed March 8, 2021
| |||||

 EncycloReader
is supported by the
EncycloReader
is supported by the