United States House election in Vermont (August 14, 2018 Democratic primary)
 From Ballotpedia - Reading time: 14 min
- General election: Nov. 6
- Voter registration deadline: Nov. 6
- Early voting: Sept. 21 - Nov. 5
- Absentee voting deadline: Nov. 5
- Online registration: Yes
- Same-day registration: Yes
- Voter ID: No
- Poll times: 10:00 a.m. to 7:00 p.m.[2]
2020 →
← 2016
|
| Vermont's At-Large Congressional District |
|---|
| Democratic primary Republican primary General election |
| Election details |
| Filing deadline: May 31, 2018 |
| Primary: August 14, 2018 General: November 6, 2018 Pre-election incumbent: Peter Welch (Democrat) |
| How to vote |
| Poll times: Open between 5 a.m. to 10 a.m.; close at 7 p.m. Voting in Vermont |
| Race ratings |
Sabato's Crystal Ball: Safe Democratic Inside Elections: Solid Democratic |
| Ballotpedia analysis |
| U.S. Senate battlegrounds U.S. House battlegrounds Federal and state primary competitiveness Ballotpedia's Election Analysis Hub, 2018 |
| See also |
U.S. Senate • At-large Vermont elections, 2018 U.S. Congress elections, 2018 U.S. Senate elections, 2018 U.S. House elections, 2018 |
A Democratic Party primary election took place on August 14, 2018, in Vermont to determine which Democrat would run in the state's November 6, 2018, general election.
This page focuses on the Democratic primary. For an overview of the election in general, click here.
Candidates and election results[edit]
Incumbent Peter Welch defeated Daniel Freilich and Ben Mitchell in the Democratic primary for U.S. House Vermont At-large District on August 14, 2018.
Democratic primary for U.S. House Vermont At-large District
Candidate |
% |
Votes |
||
| ✔ |
|
Peter Welch |
84.0
|
54,330 |
|
|
Daniel Freilich |
11.9
|
7,711 | |
|
|
Ben Mitchell |
4.1
|
2,624 | |


|
Total votes: 64,665 | |||
Do you want a spreadsheet of this type of data? Contact our sales team. |
||||
District analysis[edit]
- See also: The Cook Political Report's Partisan Voter Index
- See also: FiveThirtyEight's elasticity scores
The 2017 Cook Partisan Voter Index for this district is D+15, meaning that in the previous two presidential elections, this district's results were 15 percentage points more Democratic than the national average. This made Vermont's At-Large Congressional District the 89th most Democratic nationally.[3]
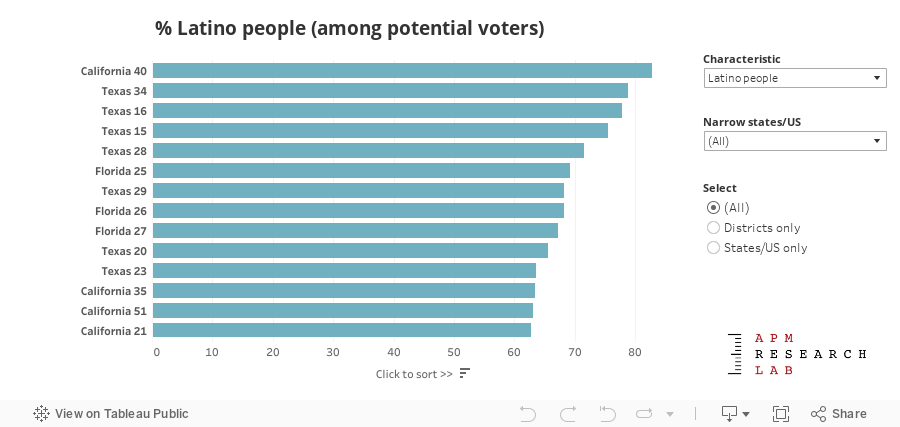
District demographics[edit]
The table below presents demographic data in Congressional Districts from the U.S. Census Bureau. Use the drop-down boxes on the right side of the table to sort the data by characteristic information and state. The tables were provided by the American Public Media Research Lab.
Campaign finance[edit]
The table below contains data from FEC Quarterly October 2017 reports. It includes only candidates who reported at least $10,000 in campaign contributions as of September 30, 2017.[4]
![]() Democrats
Democrats
Pivot Counties[edit]
- See also: Pivot Counties by state
One of 14 Vermont counties—7.14 percent—is a Pivot County. Pivot Counties are counties that voted for Barack Obama (D) in 2008 and 2012 and for Donald Trump (R) in 2016. Altogether, the nation had 206 Pivot Counties, with most being concentrated in upper midwestern and northeastern states.
| Counties won by Trump in 2016 and Obama in 2012 and 2008 | |||||||
|---|---|---|---|---|---|---|---|
| County | Trump margin of victory in 2016 | Obama margin of victory in 2012 | Obama margin of victory in 2008 | ||||
| Essex County, Vermont | 16.65% | 13.40% | 14.48% | ||||
In the 2016 presidential election, Hillary Clinton (D) won Vermont with 56.7 percent of the vote. Donald Trump (R) received 30.3 percent. In presidential elections between 1900 and 2016, Vermont cast votes for the winning presidential candidate 60.0 percent of the time. In that same time frame, Vermont supported Republican candidates for president more often than Democratic candidates, 70.0 to 26.7 percent. The state, however, favored Democrats in every election between between 2000 and 2016.
Presidential results by legislative district[edit]
The following table details results of the 2012 and 2016 presidential elections by state House districts in Vermont. Click [show] to expand the table. The "Obama," "Romney," "Clinton," and "Trump" columns describe the percent of the vote each presidential candidate received in the district. The "2012 Margin" and "2016 Margin" columns describe the margin of victory between the two presidential candidates in those years. The "Party Control" column notes which party held that seat heading into the 2018 general election. Data on the results of the 2012 and 2016 presidential elections broken down by state legislative districts was compiled by Daily Kos.[5][6]
| In 2012, Barack Obama (D) won all 104 state House districts in Vermont with an average margin of victory of 35.6 points. In 2016, Hillary Clinton (D) won 92 out of 104 state House districts in Vermont with an average margin of victory of 29.4 points. Clinton won 27 districts controlled by Republicans heading into the 2018 elections. |
| In 2016, Donald Trump (R) won 12 out of 104 state House districts in Vermont with an average margin of victory of 6.1 points. |
| 2016 presidential results by state House district | |||||||
|---|---|---|---|---|---|---|---|
| District | Obama | Romney | 2012 Margin | Clinton | Trump | 2016 Margin | Party Control |
| Addison 1 | 78.61% | 19.72% | D+58.9 | 73.14% | 16.23% | D+56.9 | D |
| Addison 2 | 69.22% | 28.79% | D+40.4 | 58.77% | 28.57% | D+30.2 | D |
| Addison 3 | 63.92% | 34.30% | D+29.6 | 53.35% | 32.58% | D+20.8 | R |
| Addison 4 | 69.91% | 27.92% | D+42 | 57.20% | 28.08% | D+29.1 | D |
| Addison 5 | 64.54% | 33.66% | D+30.9 | 57.67% | 30.54% | D+27.1 | R |
| Addison-Rutland | 61.79% | 36.36% | D+25.4 | 46.78% | 39.69% | D+7.1 | I |
| Bennington 1 | 66.69% | 31.49% | D+35.2 | 47.37% | 41.39% | D+6 | D |
| Bennington 2-1 | 71.88% | 26.56% | D+45.3 | 57.91% | 31.85% | D+26.1 | D |
| Bennington 2-2 | 69.19% | 28.56% | D+40.6 | 53.61% | 32.86% | D+20.7 | R |
| Bennington 3 | 63.18% | 35.60% | D+27.6 | 52.48% | 36.34% | D+16.1 | D |
| Bennington 4 | 61.34% | 37.14% | D+24.2 | 56.86% | 32.22% | D+24.6 | D |
| Bennington-Rutland | 63.86% | 34.30% | D+29.6 | 56.40% | 32.71% | D+23.7 | D |
| Caledonia 1 | 58.29% | 40.09% | D+18.2 | 46.08% | 41.83% | D+4.3 | R |
| Caledonia 2 | 67.98% | 29.45% | D+38.5 | 47.87% | 34.64% | D+13.2 | D |
| Caledonia 3 | 61.29% | 37.03% | D+24.3 | 48.80% | 36.88% | D+11.9 | R |
| Caledonia 4 | 57.24% | 40.87% | D+16.4 | 41.56% | 43.46% | R+1.9 | R |
| Caledonia-Washington | 63.67% | 34.67% | D+29 | 51.67% | 33.37% | D+18.3 | D |
| Chittenden 01 | 71.48% | 26.98% | D+44.5 | 67.12% | 20.40% | D+46.7 | D |
| Chittenden 02 | 65.22% | 33.25% | D+32 | 62.62% | 26.44% | D+36.2 | D |
| Chittenden 03 | 65.97% | 32.64% | D+33.3 | 61.54% | 26.36% | D+35.2 | D |
| Chittenden 04-1 | 70.22% | 27.37% | D+42.9 | 70.03% | 19.98% | D+50.1 | D |
| Chittenden 04-2 | 71.92% | 27.00% | D+44.9 | 64.69% | 23.40% | D+41.3 | D |
| Chittenden 05-1 | 71.39% | 27.56% | D+43.8 | 73.69% | 16.99% | D+56.7 | D |
| Chittenden 05-2 | 64.48% | 34.72% | D+29.8 | 65.74% | 24.00% | D+41.7 | D |
| Chittenden 06-1 | 73.33% | 25.00% | D+48.3 | 68.18% | 19.28% | D+48.9 | R |
| Chittenden 06-2 | 81.29% | 16.20% | D+65.1 | 74.14% | 12.15% | D+62 | D |
| Chittenden 06-3 | 87.46% | 8.13% | D+79.3 | 77.48% | 7.09% | D+70.4 | D |
| Chittenden 06-4 | 87.35% | 9.85% | D+77.5 | 84.08% | 6.22% | D+77.9 | D |
| Chittenden 06-5 | 84.04% | 13.57% | D+70.5 | 79.70% | 9.35% | D+70.4 | D |
| Chittenden 06-6 | 86.38% | 11.06% | D+75.3 | 83.38% | 6.61% | D+76.8 | D |
| Chittenden 06-7 | 76.38% | 21.25% | D+55.1 | 68.99% | 16.97% | D+52 | D |
| Chittenden 07-1 | 69.24% | 29.29% | D+40 | 73.55% | 16.77% | D+56.8 | D |
| Chittenden 07-2 | 66.05% | 32.68% | D+33.4 | 68.91% | 21.77% | D+47.1 | D |
| Chittenden 07-3 | 74.70% | 23.84% | D+50.9 | 72.55% | 16.95% | D+55.6 | D |
| Chittenden 07-4 | 67.67% | 30.40% | D+37.3 | 63.27% | 23.67% | D+39.6 | D |
| Chittenden 08-1 | 63.84% | 34.92% | D+28.9 | 60.06% | 26.88% | D+33.2 | R |
| Chittenden 08-2 | 64.48% | 34.53% | D+30 | 60.42% | 26.30% | D+34.1 | D |
| Chittenden 08-3 | 63.28% | 35.33% | D+28 | 57.69% | 29.72% | D+28 | R |
| Chittenden 09-1 | 65.51% | 32.53% | D+33 | 58.56% | 29.99% | D+28.6 | D |
| Chittenden 09-2 | 61.62% | 36.83% | D+24.8 | 57.15% | 32.15% | D+25 | R |
| Chittenden 10 | 56.34% | 42.05% | D+14.3 | 44.86% | 41.02% | D+3.8 | R |
| Essex-Caledonia | 55.85% | 41.74% | D+14.1 | 33.67% | 51.19% | R+17.5 | R |
| Essex-Caledonia-Orleans | 56.71% | 40.90% | D+15.8 | 40.48% | 46.69% | R+6.2 | R |
| Franklin 1 | 56.33% | 42.11% | D+14.2 | 42.51% | 42.68% | R+0.2 | R |
| Franklin 2 | 59.89% | 38.80% | D+21.1 | 44.95% | 40.04% | D+4.9 | I |
| Franklin 3-1 | 63.98% | 33.78% | D+30.2 | 49.74% | 34.04% | D+15.7 | D |
| Franklin 3-2 | 57.29% | 41.61% | D+15.7 | 45.35% | 41.77% | D+3.6 | R |
| Franklin 4 | 60.36% | 38.33% | D+22 | 40.34% | 45.02% | R+4.7 | R |
| Franklin 5 | 58.72% | 40.18% | D+18.5 | 35.83% | 49.01% | R+13.2 | R |
| Franklin 6 | 65.67% | 32.98% | D+32.7 | 49.96% | 35.10% | D+14.9 | D |
| Franklin 7 | 66.65% | 31.58% | D+35.1 | 43.39% | 35.62% | D+7.8 | D |
| Grand Isle-Chittenden | 60.99% | 37.41% | D+23.6 | 49.75% | 37.02% | D+12.7 | D |
| Lamoille 1 | 68.19% | 30.22% | D+38 | 69.48% | 19.68% | D+49.8 | R |
| Lamoille 2 | 70.83% | 27.53% | D+43.3 | 50.64% | 32.32% | D+18.3 | D |
| Lamoille 3 | 70.65% | 27.54% | D+43.1 | 53.32% | 28.92% | D+24.4 | R |
| Lamoille-Washington | 71.51% | 26.57% | D+44.9 | 58.00% | 26.53% | D+31.5 | R |
| Orange 1 | 58.31% | 39.63% | D+18.7 | 42.42% | 42.15% | D+0.3 | R |
| Orange 2 | 64.98% | 32.84% | D+32.1 | 55.12% | 31.81% | D+23.3 | D |
| Orange-Caledonia | 57.42% | 40.35% | D+17.1 | 43.05% | 42.95% | D+0.1 | D |
| Orange-Washington-Addison | 66.89% | 30.66% | D+36.2 | 50.86% | 32.34% | D+18.5 | D |
| Orleans 1 | 57.58% | 41.05% | D+16.5 | 38.00% | 48.39% | R+10.4 | R |
| Orleans 2 | 60.04% | 38.38% | D+21.7 | 41.10% | 44.70% | R+3.6 | R |
| Orleans-Caledonia | 66.04% | 31.37% | D+34.7 | 50.36% | 34.64% | D+15.7 | R |
| Orleans-Lamoille | 62.90% | 35.29% | D+27.6 | 38.19% | 45.72% | R+7.5 | R |
| Rutland 1 | 62.40% | 35.58% | D+26.8 | 44.77% | 41.69% | D+3.1 | R |
| Rutland 2 | 58.07% | 40.32% | D+17.8 | 41.79% | 46.66% | R+4.9 | R |
| Rutland 3 | 59.35% | 38.86% | D+20.5 | 43.82% | 44.95% | R+1.1 | R |
| Rutland 4 | 53.35% | 45.33% | D+8 | 46.30% | 42.60% | D+3.7 | R |
| Rutland 5-1 | 58.72% | 39.96% | D+18.8 | 51.76% | 37.64% | D+14.1 | R |
| Rutland 5-2 | 62.58% | 35.99% | D+26.6 | 49.43% | 38.20% | D+11.2 | R |
| Rutland 5-3 | 65.98% | 32.04% | D+33.9 | 43.64% | 41.41% | D+2.2 | D |
| Rutland 5-4 | 65.35% | 33.01% | D+32.3 | 50.18% | 37.74% | D+12.4 | R |
| Rutland 6 | 64.46% | 34.08% | D+30.4 | 47.22% | 40.73% | D+6.5 | R |
| Rutland-Bennington | 59.97% | 37.76% | D+22.2 | 46.55% | 42.55% | D+4 | D |
| Rutland-Windsor 1 | 58.43% | 39.88% | D+18.6 | 50.19% | 37.79% | D+12.4 | R |
| Rutland-Windsor 2 | 59.10% | 39.25% | D+19.9 | 47.71% | 39.64% | D+8.1 | R |
| Washington 1 | 64.81% | 33.13% | D+31.7 | 50.56% | 33.17% | D+17.4 | R |
| Washington 2 | 54.50% | 44.43% | D+10.1 | 42.23% | 44.67% | R+2.4 | R |
| Washington 3 | 63.64% | 34.27% | D+29.4 | 51.40% | 33.92% | D+17.5 | I |
| Washington 4 | 82.35% | 15.60% | D+66.8 | 77.51% | 10.31% | D+67.2 | D |
| Washington 5 | 74.14% | 24.03% | D+50.1 | 64.35% | 21.46% | D+42.9 | D |
| Washington 6 | 73.13% | 23.75% | D+49.4 | 59.73% | 23.75% | D+36 | D |
| Washington 7 | 73.96% | 23.97% | D+50 | 65.84% | 19.63% | D+46.2 | D |
| Washington-Chittenden | 74.03% | 23.77% | D+50.3 | 65.01% | 20.78% | D+44.2 | D |
| Windham 1 | 64.09% | 34.24% | D+29.9 | 52.95% | 33.23% | D+19.7 | R |
| Windham 2-1 | 77.60% | 21.22% | D+56.4 | 69.48% | 19.88% | D+49.6 | D |
| Windham 2-2 | 84.66% | 13.55% | D+71.1 | 73.22% | 11.57% | D+61.6 | D |
| Windham 2-3 | 84.57% | 13.33% | D+71.2 | 77.37% | 11.26% | D+66.1 | D |
| Windham 3 | 71.91% | 26.16% | D+45.8 | 58.54% | 28.08% | D+30.5 | D |
| Windham 4 | 79.09% | 18.96% | D+60.1 | 69.84% | 18.14% | D+51.7 | D |
| Windham 5 | 76.77% | 21.43% | D+55.3 | 66.52% | 21.03% | D+45.5 | D |
| Windham 6 | 64.99% | 33.73% | D+31.3 | 50.77% | 37.85% | D+12.9 | D |
| Windham-Bennington | 60.08% | 37.35% | D+22.7 | 47.76% | 41.47% | D+6.3 | I |
| Windham-Bennington-Windsor | 63.24% | 35.05% | D+28.2 | 58.08% | 29.82% | D+28.3 | I |
| Windsor 1 | 70.41% | 28.28% | D+42.1 | 59.89% | 27.58% | D+32.3 | D |
| Windsor 2 | 61.49% | 36.79% | D+24.7 | 46.44% | 40.17% | D+6.3 | D |
| Windsor 3-1 | 63.59% | 34.21% | D+29.4 | 51.81% | 35.44% | D+16.4 | D |
| Windsor 3-2 | 62.37% | 35.67% | D+26.7 | 47.36% | 37.98% | D+9.4 | D |
| Windsor 4-1 | 65.70% | 32.94% | D+32.8 | 61.36% | 27.51% | D+33.8 | D |
| Windsor 4-2 | 71.62% | 27.38% | D+44.2 | 62.89% | 24.29% | D+38.6 | D |
| Windsor 5 | 69.64% | 28.75% | D+40.9 | 66.24% | 23.26% | D+43 | D |
| Windsor-Orange 1 | 67.92% | 29.45% | D+38.5 | 51.86% | 32.10% | D+19.8 | R |
| Windsor-Orange 2 | 80.33% | 18.08% | D+62.3 | 74.90% | 15.46% | D+59.4 | D |
| Windsor-Rutland | 66.94% | 31.26% | D+35.7 | 55.30% | 30.30% | D+25 | D |
| Total | 67.03% | 31.19% | D+35.8 | 56.68% | 30.27% | D+26.4 | - |
| Source: Daily Kos | |||||||
State overview[edit]
Partisan control[edit]
This section details the partisan control of federal and state positions in Vermont heading into the 2018 elections.
Congressional delegation[edit]
- Following the 2016 elections, one Democrat and one Independent held the two U.S. Senate seats in Vermont.
- A Democrat held the only U.S. House seat in Vermont.
State executives[edit]
- As of September 2018, Democrats held four of 10 state executive positions, Republicans held one, and the remaining five positions were officially nonpartisan.
- The governor of Vermont was Republican Phil Scott. The state held elections for governor on November 6, 2018.
State legislature[edit]
- Democrats controlled both chambers of the Vermont General Assembly. They had a 80-53 majority in the state House and a 21-7 majority in the state Senate.
Trifecta status[edit]
- Vermont was under divided government, meaning that the two parties shared control of the state government. Phil Scott (R) served as governor, while Democrats controlled the state legislature.
2018 elections[edit]
- See also: Vermont elections, 2018
Vermont held elections for the following positions in 2018:
- 1 U.S. Senate seat
- 1 U.S. House seat
- Governor
- 5 lower state executive positions
- All 30 state Senate seats
- All 150 state House seats
- Local judges
Demographics[edit]
| Demographic data for Vermont | ||
|---|---|---|
| Vermont | U.S. | |
| Total population: | 626,088 | 316,515,021 |
| Land area (sq mi): | 9,217 | 3,531,905 |
| Race and ethnicity** | ||
| White: | 94.9% | 73.6% |
| Black/African American: | 1.1% | 12.6% |
| Asian: | 1.4% | 5.1% |
| Native American: | 0.3% | 0.8% |
| Pacific Islander: | 0% | 0.2% |
| Two or more: | 1.9% | 3% |
| Hispanic/Latino: | 1.7% | 17.1% |
| Education | ||
| High school graduation rate: | 91.8% | 86.7% |
| College graduation rate: | 36% | 29.8% |
| Income | ||
| Median household income: | $55,176 | $53,889 |
| Persons below poverty level: | 13.2% | 11.3% |
| Source: U.S. Census Bureau, "American Community Survey" (5-year estimates 2010-2015) Click here for more information on the 2020 census and here for more on its impact on the redistricting process in Vermont. **Note: Percentages for race and ethnicity may add up to more than 100 percent because respondents may report more than one race and the Hispanic/Latino ethnicity may be selected in conjunction with any race. Read more about race and ethnicity in the census here. | ||
As of July 2016, Vermont's largest cities by population were Burlington (pop. est. 42,239), Essex (pop. est. 21,519), and South Burlington (pop. est. 19,141).[7]
State election history[edit]
This section provides an overview of federal and state elections in Vermont from 2000 to 2016. All data comes from the Vermont Secretary of State.[8]
Historical elections[edit]
Presidential elections[edit]
This chart shows the results of the presidential election in Vermont every year from 2000 to 2016.
| Election results (President of the United States), Vermont 2000-2016 | |||||
|---|---|---|---|---|---|
| Year | First-place candidate | First-place candidate votes (%) | Second-place candidate | Second-place candidate votes (%) | Margin of victory (%) |
| 2016 | 56.7% | 30.3% | 26.4% | ||
| 2012 | 66.8% | 31.1% | 35.7% | ||
| 2008 | 67.5% | 30.4% | 37.1% | ||
| 2004 | 58.9% | 38.8% | 20.1% | ||
| 2000 | 50.6% | 40.7% | 9.9% | ||
U.S. Senate elections, 2000-2016[edit]
This chart shows the results of U.S. Senate races in Vermont from 2000 to 2016. Every state has two Senate seats, and each seat goes up for election every six years. The terms of the seats are staggered so that roughly one-third of the seats are up every two years.
| Election results (U.S. Senator), Vermont 2000-2016 | |||||
|---|---|---|---|---|---|
| Year | First-place candidate | First-place candidate votes (%) | Second-place candidate | Second-place candidate votes (%) | Margin of victory (%) |
| 2016 | 61.3% | 33.0% | 28.3% | ||
| 2012 | 71.0% | 24.9% | 46.1% | ||
| 2010 | 64.3% | 30.9% | 33.4% | ||
| 2006 | 65.4% | 32.4% | 33.0% | ||
| 2004 | 70.6% | 24.5% | 46.1% | ||
| 2000 | 65.6% | 25.4% | 40.2% | ||
Gubernatorial elections, 2000-2016[edit]
This chart shows the results of the four gubernatorial elections held between 2000 and 2016. Gubernatorial elections are held every two years in Vermont.
| Election results (Governor), Vermont 2000-2016 | |||||
|---|---|---|---|---|---|
| Year | First-place candidate | First-place candidate votes (%) | Second-place candidate | Second-place candidate votes (%) | Margin of victory (%) |
| 2016 | 52.9% | 44.2% | 8.7% | ||
| 2014 | 46.5% | 45.2% | 1.3% | ||
| 2012 | 58.0% | 37.7% | 20.3% | ||
| 2010 | 49.5% | 47.7% | 1.8% | ||
| 2008 | 53.4% | 21.9% | 31.5% | ||
| 2006 | 56.4% | 41.2% | 15.2% | ||
| 2004 | 58.7% | 37.9% | 20.8% | ||
| 2002 | 44.9% | 42.4% | 2.5% | ||
| 2000 | 50.5% | 37.9% | 12.6% | ||
Congressional delegation, 2000-2016[edit]
See the list below for the members elected to represent Vermont in the U.S. House from 2000 to 2016. Vermont has one at-large representative in the House. Elections for U.S. House seats are held every two years.
 Peter Welch (2007-Present)
 Bernie Sanders (1991-2007)
Trifectas, 1992-2017[edit]
“A state government trifecta occurs when one party controls both chambers of the state legislature and the governor's office.”
Vermont Party Control: 1992-2022
Ten years of Democratic trifectas • No Republican trifectas
Scroll left and right on the table below to view more years.
| Year | 92 | 93 | 94 | 95 | 96 | 97 | 98 | 99 | 00 | 01 | 02 | 03 | 04 | 05 | 06 | 07 | 08 | 09 | 10 | 11 | 12 | 13 | 14 | 15 | 16 | 17 | 18 | 19 | 20 | 21 | 22 |
|---|---|---|---|---|---|---|---|---|---|---|---|---|---|---|---|---|---|---|---|---|---|---|---|---|---|---|---|---|---|---|---|
| Governor | D | D | D | D | D | D | D | D | D | D | D | R | R | R | R | R | R | R | R | D | D | D | D | D | D | R | R | R | R | R | R |
| Senate | D | R | R | R | R | D | D | D | D | D | D | D | D | D | D | D | D | D | D | D | D | D | D | D | D | D | D | D | D | D | D |
| House | R | D | D | D | D | D | D | D | D | R | R | R | R | D | D | D | D | D | D | D | D | D | D | D | D | D | D | D | D | D | D |
See also[edit]
- United States House of Representatives election in Vermont, 2018
- United States House election in Vermont (August 14, 2018 Republican primary)
- United States House of Representatives elections, 2018
Footnotes[edit]
- ↑ Polls may have opened earlier than 10:00 a.m.; 10:00 a.m. was the latest poll opening time.
- ↑ Polls may have opened earlier than 10:00 a.m.; 10:00 a.m. was the latest poll opening time.
- ↑ Cook Political Report, "Introducing the 2017 Cook Political Report Partisan Voter Index," April 7, 2017
- ↑ FEC, "Federal Election Commission," accessed November 5, 2017
- ↑ Daily Kos, "Daily Kos Elections' statewide election results by congressional and legislative districts," July 9, 2013
- ↑ Daily Kos, "Daily Kos Elections' 2016 presidential results for congressional and legislative districts," February 6, 2017
- ↑ Vermont Demographics, "Vermont Cities by Population," accessed September 6, 2018
- ↑ Vermont Secretary of State, "Election Results Archive," accessed September 6, 2018

| |||||||||||
 EncycloReader
is supported by the
EncycloReader
is supported by the