Geographic information system
 From Citizendium - Reading time: 5 min
In information science, a geographic information system (GIS) is typically defined as a computer software package designed to facilitate the analysis and display of geographically referenced spatial data by providing four general capabilities:
- Data input (encoding)
- Data management (i.e. archival, storage, query and retrieval)
- Statistical analysis (both basic data analysis and methods unique to spatial analysis)
- Output (display and input into other software)
All four of these functions involve interactions between the software system and the user, and most modern GIS packages are designed to allow the user to display the data and results associated with each function inside the program (i.e. most packages include a visual display and a graphical user interface, or GUI). GIS is primarily used to analyze spatial data acquired from cartographic records or remote sensing imagery, although GIS could theoretically be used to analyze any type of multidimensional data. [1]
Geographic information systems are a tool utilized by a wide variety of disciplines including resource management, conservation, asset management, cartography, market analysis, logistics, real estate, defense, emergency management, transportation, and medical topography.
GIS Data Types[edit]
Data within a GIS can be represented in two general formats - raster and vector. The type of analysis being conducted and the nature of the data themselves largely determine which format will be used. The basic guideline that rasters are useful when representing spatially continuous variables while vector files are useful for representing categorical variables, is helpful, but significant exceptions exist. More commonly, raster layers will be used in modelling or geospatial analyses, while vector layers will be used in mapping and geographic analyses.
Raster Data[edit]

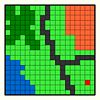
Raster data organizes information in a grid with a single attribute value assigned to each pixel, or cell. While grid cells are typically square, specific applications may call for the use of rectangular or other cell shapes. Each cell represents the same spatial area in a raster map, and the spatial distance represented by the x and y dimensions of the cells, called the grid resolution, determine the smallest spatial feature that the raster can resolve, or its resolving power. Satellite and aerial imagery is usually stored in a raster format, while the classified imagery are usually stored as vectors. In remote sensing, an raster's scale is usually a synonym for its grid resolution, and the extent is the spatial area covered by the image. In landscape ecology, on the other hand, 'scale' typically refers to the extent, and 'resolution' refers to the resolving power. The spatial position of a given cell in a raster grid can be represented by its two-dimensional distance (e.g. up and over) from a reference point (e.g. the bottom left corner), and the distance between two cells can be represented by the number of cells between them. This makes rasters ideal data formats for modeling applications or for processes or features that vary continuously in over the map area.
Vector Data[edit]

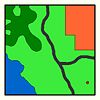
Rather than a grid, the spatial positions of the data in a vector layer are stored as a series of nodes for each polygon, line, or point (a single node). Each line consists of two or more nodes, and each polygon is enclosed by a series of lines. A node's spatial position in a vector map is determined by its x, y co-ordinates, and the distance between two features is determined by the differences in the the x,y co-ordinates of their nearest nodes. By linking each polygon/line/point feature to an attribute table, vector data can associate multiple attributes with individual features. While this data format is ideal for classified data, it does not work as well with spatially continuous variables. This is why most GIS projects consist of both raster and vector data layers.
GIS and Remote Sensing[edit]
Because much of the spatial data used in GIS is based on remotely sensed images, the software systems designed for GIS and those designed for the processing of remotely sensed images are intimately related, and many of the major GIS packages include at least basic image processing capabilities, and image processing applications vice versa. The image processing capabilities of most GIS platforms consists primarily of geometric and spectral correction, rectification and classification utilities.
GIS software packages[edit]
As with many other software applications, both proprietary systems and open source systems are available. The majority of the proprietary systems are limited to the Microsoft Windows operating system, while the open source systems tend to work with several different OS types.
ArcGIS[edit]
ArcGIS is actually the name of a suite of GIS applications developed by Environmental Systems Research Institute, Inc. (ESRI). Its Desktop environment, ArcInfo Desktop, is the most commonly used GIS application. While some components of the ArcGIS fleet are certified for Linux systems (e.g. ArcSDE), ArcInfo Desktop is only available to Windows users[2]. ArcGIS 9.2 was not originally supported on Windows Vista, but Service Pack 4 provides Vista support for most of the ArcGIS applications[3].
IDRISI[edit]
IDRISI, the latest version being Andes, attempts to integrate GIS and image processing into a single package.
IMAGINE[edit]
ERDAS' flagship product is primarily used to classify and extract data from images collected by remote sensing platforms and other image analysis tasks.
MultiSpec[edit]
Developed by David Landgrebe and Larry Biehl at Purdue University, MultiSpec is designed to facilitate the classification and analysis of multispectral and hyperspectral imagery. The program and its documentation is available for the Windows and Macintosh systems as freeware.
GRASS[edit]
Geographic Resources Analysis and Support System (GRASS) is probably the most widely-used Open-Source GIS package (cite me, too). Unlike ArcGIS, IDRISI and IMAGINE, GRASS operates on Windows, Linux and Mac platforms.
Quantum GIS[edit]
Quantum GIS (QGIS) is also a very popular Open-Source GIS package. QGIS and GRASS can operate in concert.
GDAL/OGR[edit]
The Geographic Data Abstraction Library is an Open-Source development library that provides a series of raster processing utilities and conversion functions. OGR, which is part of the GDAL source tree, provides similar functionality for vector data. GDAL is used in many of the above packages, including GRASS and ArcGIS (as of 9.2).
OpenJump[edit]
Open Jump is a JDK-based open source GIS written in Java. The look-and-feel is very similar to ArcMap though its basic functionality is more limited. However, it has a plugin architecture that can add functionality from some of the other resources and data formats listed here (including raster data).
Notes[edit]
- ↑ Jensen, J. R. (1996) Introductory Digital Image Processing: A Remote Sensing Perspective. Prentice Hall Series in Geographic Information Science. Clarke, K. C. (ed.). Prentice Hall, Upper Saddle River, New Jersey, United States. 316 p.
- ↑ System Requirements for ArcInfo Desktop]. ESRI Support Center. http://support.esri.com/
- ↑ FAQ: Does ArcGIS support Microsoft Windows Vista? ESRI Technical Article 34020. Modified 4 December 2007 http://support.esri.com/
 KSF
KSF