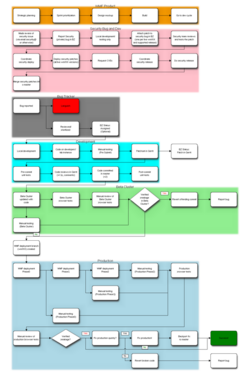
Deployment flowchart
Topic: Finance
 From HandWiki - Reading time: 2 min

A deployment flowchart (sometimes referred to as a cross functional flowchart) is a business process mapping tool used to articulate the steps and stakeholders of a given process.
"Deployment flowcharts consist of a sequence of activity steps and also the interactions between individuals or groups."[1] Each participant in the process is displayed on the map (which is constructed as a matrix) - tasks/activity are then articulated in sequence under the column corresponding to that stakeholder.
As deployment flowcharts highlight the relationships between stakeholders in addition to the process flow[2] they are especially useful in highlighting areas of inefficiency, duplication or unnecessary processing.[3] Often utilized within Six sigma activity,[4] completed flowcharts are commonly used to examine the interfaces between “participants” which are typically causes for delays and other associated issues. Deployment flowcharts are useful for determining who within an organization is required to implement a process and are sometimes used as a business planning tool.
While deployment flowcharts can be drawn by hand using pen and paper – various software tools include functionality to construct the flowcharts on computer, these include products such as Microsoft Visio.[5]
As with other process mapping techniques, deployment flowcharts require a certain degree of detail (and accuracy) to provide useful benefit. Care and attention is required to ensure that the correct stakeholder is attributed to the correct parts of the process. Complex flowcharts may be difficult to interpret, especially where a flow is unclear, or many stakeholders are identified. Consistent terminology throughout the map is also important to provide clarity to the reader.[6]
See also
References
- ↑ The Leader's Handbook: Making Things Happen, Getting Things Done By Peter R. Scholtes
- ↑ Essential Readings in Nursing Managed Care By Susan Odegaard Turner, Aspen Reference Group (Aspen Publishers)
- ↑ How to draw a deployment flowchart? - Leanyourcompany.com
- ↑ Rath & Strong's Six Sigma Leadership Handbook By Rath & Strong, Thomas Bertels
- ↑ Identify Cross-Department Dependencies with Microsoft Visio Flowcharts
- ↑ Flowcharts: Plain & Simple. By Joiner Assocs., Inc. Staff
 |
 KSF
KSF