Indicator diagram
 From HandWiki - Reading time: 7 min


An indicator diagram is a chart used to measure the thermal, or cylinder, performance of reciprocating steam and internal combustion engines and compressors.[1] An indicator chart records the pressure in the cylinder versus the volume swept by the piston, throughout the two or four strokes of the piston which constitute the engine, or compressor, cycle. The indicator diagram is used to calculate the work done and the power produced in an engine cylinder[2] or used in a compressor cylinder.
The indicator diagram was developed by James Watt and his employee John Southern to help understand how to improve the efficiency of steam engines.[3] In 1796, Southern developed the simple, but critical, technique to generate the diagram by fixing a board so as to move with the piston, thereby tracing the "volume" axis, while a pencil, attached to a pressure gauge, moved at right angles to the piston, tracing "pressure".[citation needed]
The gauge enabled Watt to calculate the work done by the steam while ensuring that its pressure had dropped to zero by the end of the stroke, thereby ensuring that all useful energy had been extracted. The total work could be calculated from the area between the "volume" axis and the traced line. The latter fact had been realised by Davies Gilbert as early as 1792 and used by Jonathan Hornblower in litigation against Watt over patents on various designs. Daniel Bernoulli had also had the insight about how to calculate work.[citation needed]
Watt used the diagram to make radical improvements to steam engine performance and long kept it a trade secret. Though it was made public in a letter to the Quarterly Journal of Science in 1822,[4] it remained somewhat obscure, John Farey, Jr. only learned of it on seeing it used, probably by Watt's men, when he visited Russia in 1826.
In 1834, Émile Clapeyron used a diagram of pressure against volume to illustrate and elucidate the Carnot cycle, elevating it to a central position in the study of thermodynamics.[5]
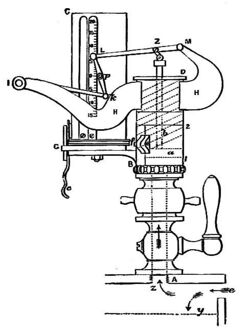
Later instruments for steam engine (illus.) used paper wrapped around a cylindrical barrel with a pressure piston inside it, the rotation of the barrel coupled to the piston crosshead by a weight- or spring-tensioned wire.[citation needed]
In 1869 the British marine engineer Nicholas Procter Burgh wrote a full book on the indicator diagram explaining the device step by step. He had noticed that "a very large proportion of the young members of the engineering profession look at an indicator diagram as a mysterious production."[6]
Indicators developed for steam engines were improved for internal combustion engines with their rapid changes in pressure, resulting from combustion, and higher speeds. In addition to using indicator diagrams for calculating power they are used to understand the ignition, injection timing and combustion events which occur near dead-center, when the engine piston and indicator drum are hardly moving. Much better information during this part of the cycle is obtained by offsetting the indicator motion by 90 degrees to the engine crank, giving an offset indicator diagram. The events are recorded when the velocity of the drum is near its maximum and are shown against crank-angle instead of stroke.[7]

Examples
See also
References
- ↑ Engineering Thermodynamics Work and Heat Transfer, Second edition, Rogers and Mayhew 1967, Longman's Green and Co. Ltd., p. 350-354.
- ↑ Pounders Marine Diesel and Gas Turbine Engines, Eighth edition 2004, edited by Doug Woodyard, ISBN 0 7506 5846 0, p. 3.
- ↑ Bruce J. Hunt (2010) Pursuing Power and Light, page 13, The Johns Hopkins University Press ISBN 0-8018-9359-3
- ↑ (Anonymous), "Account of a steam-engine indicator," Quarterly Journal of Science, vol. 13, page 95 (1822).
- ↑ Clapeyron, E. (1834) "Mémoire sur la puissance motrice de la chaleur" (Memoir on the motive power of heat), Journal de l'École Royale Polytechnique, vol. 14, no. 23, pages 153–190, 160–162.
- ↑ Nicholas Procter Burgh. The Indicator Diagram Practically Considered. E. & F. N. Spon, 1869. p. 1
- ↑ Internal Combustion Engines Theory and Design, Maleev, First edition 1933, McGraw-Hill Book company, Inc., p. 33.
- ↑ "circa". Dictionary.com. http://dictionary.reference.com/browse/circa.
External links
See also
References
Bibliography
- Cardwell, D.S.L. (1971). From Watt to Clausius: The Rise of Thermodynamics in the Early Industrial Age. Heinemann: London. pp. 79–81. ISBN 0-435-54150-1.
- Pacey, A.J. & Fisher, S.J. (1967) "Daniel Bernoulli and the vis viva of compressed air", The British Journal for the History of Science 3 (4), pp. 388–392, doi:10.1017/S0007087400002934
- British Transport Commission (1957) Handbook for Railway Steam Locomotive Enginemen, London : B.T.C., p. 81, (facsimile copy publ. Ian Allan (1977), ISBN 0-7110-0628-8)
External links
- Walter, John. "The Engine Indicator. A collectors' guide to mechanical and optical/mechanical designs, 1800 to date". Canadian Museum of Making. http://www.archivingindustry.com/Indicator/contentback.htm.
 |
 KSF
KSF