Satellite temperature measurements
Topic: Physics
 From HandWiki - Reading time: 13 min
Satellite temperature measurements are inferences of the temperature of the atmosphere at various altitudes as well as sea and land surface temperatures obtained from radiometric measurements by satellites. These measurements can be used to locate weather fronts, monitor the El Niño-Southern Oscillation, determine the strength of tropical cyclones, study urban heat islands and monitor the global climate. Wildfires, volcanos, and industrial hot spots can also be found via thermal imaging from weather satellites.
Weather satellites do not measure temperature directly. They measure radiances in various wavelength bands. Since 1978 microwave sounding units (MSUs) on National Oceanic and Atmospheric Administration polar orbiting satellites have measured the intensity of upwelling microwave radiation from atmospheric oxygen, which is related to the temperature of broad vertical layers of the atmosphere. Measurements of infrared radiation pertaining to sea surface temperature have been collected since 1967.
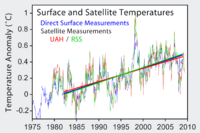
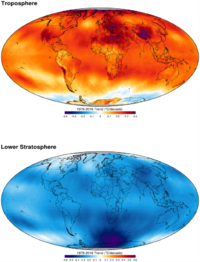
Satellite datasets show that over the past four decades the troposphere has warmed and the stratosphere has cooled. Both of these trends are consistent with the influence of increasing atmospheric concentrations of greenhouse gases.
Measurements
Satellites do not measure temperature directly. They measure radiances in various wavelength bands, which must then be mathematically inverted to obtain indirect inferences of temperature.[1][2] The resulting temperature profiles depend on details of the methods that are used to obtain temperatures from radiances. As a result, different groups that have analyzed the satellite data have produced differing temperature datasets.
The satellite time series is not homogeneous. It is constructed from a series of satellites with similar but not identical sensors. The sensors also deteriorate over time, and corrections are necessary for orbital drift and decay.[3][4][5] Particularly large differences between reconstructed temperature series occur at the few times when there is little temporal overlap between successive satellites, making intercalibration difficult.[citation needed][6]
Infrared measurements
Surface measurements
Infrared radiation can be used to measure both the temperature of the surface (using "window" wavelengths to which the atmosphere is transparent), and the temperature of the atmosphere (using wavelengths for which the atmosphere is not transparent, or measuring cloud top temperatures in infrared windows).
Satellites used to retrieve surface temperatures via measurement of thermal infrared in general require cloud-free conditions. Some of the instruments include the Advanced Very High Resolution Radiometer (AVHRR), Along Track Scanning Radiometers (AASTR), Visible Infrared Imaging Radiometer Suite (VIIRS), the Atmospheric Infrared Sounder (AIRS), and the ACE Fourier Transform Spectrometer (ACE‐FTS) on the Canadian SCISAT-1 satellite.[9]
Weather satellites have been available to infer sea surface temperature (SST) information since 1967, with the first global composites occurring during 1970.[10] Since 1982,[11] satellites have been increasingly utilized to measure SST and have allowed its spatial and temporal variation to be viewed more fully. For example, changes in SST monitored via satellite have been used to document the progression of the El Niño-Southern Oscillation since the 1970s.[12]
Over land the retrieval of temperature from radiances is harder, because of inhomogeneities in the surface.[13] Studies have been conducted on the urban heat island effect via satellite imagery.[14] By using the fractal technique, Weng, Q. et al. characterized the spatial pattern of urban heat island.[15] Use of advanced very high resolution infrared satellite imagery can be used, in the absence of cloudiness, to detect density discontinuities (weather fronts) such as cold fronts at ground level.[16] Using the Dvorak technique, infrared satellite imagery can be used to determine the temperature difference between the eye and the cloud top temperature of the central dense overcast of mature tropical cyclones to estimate their maximum sustained winds and their minimum central pressures.[17]
Along Track Scanning Radiometers aboard weather satellites are able to detect wildfires, which show up at night as pixels with a greater temperature than 308 K (35 °C; 95 °F).[18] The Moderate-Resolution Imaging Spectroradiometer aboard the Terra satellite can detect thermal hot spots associated with wildfires, volcanoes, and industrial hot spots.[19]
The Atmospheric Infrared Sounder on the Aqua satellite, launched in 2002, uses infrared detection to measure near-surface temperature.[20]
Stratosphere measurements
Stratospheric temperature measurements are made from the Stratospheric Sounding Unit (SSU) instruments, which are three-channel infrared (IR) radiometers.[21] Since this measures infrared emission from carbon dioxide, the atmospheric opacity is higher and hence the temperature is measured at a higher altitude (stratosphere) than microwave measurements.
Since 1979 the Stratospheric sounding units (SSUs) on the NOAA operational satellites have provided near global stratospheric temperature data above the lower stratosphere. The SSU is a far-infrared spectrometer employing a pressure modulation technique to make measurement in three channels in the 15 μm carbon dioxide absorption band. The three channels use the same frequency but different carbon dioxide cell pressure, the corresponding weighting functions peaks at 29 km for channel 1, 37 km for channel 2 and 45 km for channel 3.[22][clarification needed]
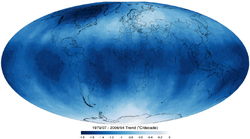
The process of deriving trends from SSUs measurement has proved particularly difficult because of satellite drift, inter-calibration between different satellites with scant overlap and gas leaks in the instrument carbon dioxide pressure cells. Furthermore since the radiances measured by SSUs are due to emission by carbon dioxide the weighting functions move to higher altitudes as the carbon dioxide concentration in the stratosphere increase. Mid to upper stratosphere temperatures shows a strong negative trend interspersed by transient volcanic warming after the explosive volcanic eruptions of El Chichón and Mount Pinatubo, little temperature trend has been observed since 1995. The greatest cooling occurred in the tropical stratosphere consistent with enhanced Brewer-Dobson circulation under greenhouse gas concentrations increase.[23][non-primary source needed]
Lower stratospheric cooling is mainly caused by the effects of ozone depletion with a possible contribution from increased stratospheric water vapor and greenhouse gases increase.[24][25] There has been a decline in stratospheric temperatures, interspersed by warmings related to volcanic eruptions. Global Warming theory suggests that the stratosphere should cool while the troposphere warms.[26]

The long term cooling in the lower stratosphere occurred in two downward steps in temperature both after the transient warming related to explosive volcanic eruptions of El Chichón and Mount Pinatubo, this behavior of the global stratospheric temperature has been attributed to global ozone concentration variation in the two years following volcanic eruptions.[27]
Since 1996 the trend is slightly positive[28] due to ozone recovery juxtaposed to a cooling trend of 0.1K/decade that is consistent with the predicted impact of increased greenhouse gases.[27]
The table below shows the stratospheric temperature trend from the SSU measurements in the three different bands, where negative trend indicated cooling.
| Channel | Start | End Date | STAR v3.0
Global Trend |
|---|---|---|---|
| TMS | 1978-11 | 2017-01 | −0.583 |
| TUS | 1978-11 | 2017-01 | −0.649 |
| TTS | 1979-07 | 2017-01 | −0.728 |
Microwave (tropospheric and stratospheric) measurements
Microwave Sounding Unit (MSU) measurements

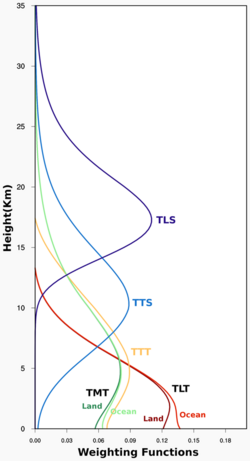
From 1979 to 2005 the microwave sounding units (MSUs) and since 1998 the Advanced Microwave Sounding Units on NOAA polar orbiting weather satellites have measured the intensity of upwelling microwave radiation from atmospheric oxygen. The intensity is proportional to the temperature of broad vertical layers of the atmosphere. Upwelling radiance is measured at different frequencies; these different frequency bands sample a different weighted range of the atmosphere.[30]
Figure 3 (right) shows the atmospheric levels sampled by different wavelength reconstructions from the satellite measurements, where TLS, TTS, and TTT represent three different wavelengths.
Other microwave measurements
A different technique is used by the Aura spacecraft, the Microwave Limb Sounder, which measure microwave emission horizontally, rather than aiming at the nadir.[9]
Temperature measurements are also made by occultation of GPS signals.[31] This technique measures the refraction of the radio signals from GPS satellites by the Earth's atmosphere, thus allowing vertical temperature and moisture profiles to be measured.
Temperature measurements on other planets
Planetary science missions also make temperature measurements on other planets and moons of the solar system, using both infrared techniques (typical of orbiter and flyby missions of planets with solid surfaces) and microwave techniques (more often used for planets with atmospheres). Infrared temperature measurement instruments used in planetary missions include surface temperature measurements taken by the Thermal Emission Spectrometer (TES) instrument on Mars Global Surveyor and the Diviner instrument on the Lunar Reconnaissance Orbiter;[32] and atmospheric temperature measurements taken by the composite infrared spectrometer instrument on the NASA Cassini spacecraft.[33]
Microwave atmospheric temperature measurement instruments include the Microwave Radiometer on the Juno mission to Jupiter.
See also
- Atmospheric sounding
- Instrumental temperature record
- Sea surface temperature
- Temperature record
References
- ↑ National Research Council (U.S.). Committee on Earth Studies (2000). "Atmospheric Soundings". Issues in the Integration of Research and Operational Satellite Systems for Climate Research: Part I. Science and Design. Washington, D.C.: National Academy Press. pp. 17–24. doi:10.17226/9963. ISBN 978-0-309-51527-6. http://books.nap.edu/openbook.php?record_id=9963&page=17. Retrieved 17 May 2007.
- ↑ Uddstrom, Michael J. (1988). "Retrieval of Atmospheric Profiles from Satellite Radiance Data by Typical Shape Function Maximum a Posteriori Simultaneous Retrieval Estimators". Journal of Applied Meteorology 27 (5): 515–49. doi:10.1175/1520-0450(1988)027<0515:ROAPFS>2.0.CO;2. Bibcode: 1988JApMe..27..515U.
- ↑ Po-Chedley, S.; Thorsen, T. J.; Fu, Q. (2015). "Removing Diurnal Cycle Contamination in Satellite-Derived Tropospheric Temperatures: Understanding Tropical Tropospheric Trend Discrepancies". Journal of Climate 28 (6): 2274–2290. doi:10.1175/jcli-d-13-00767.1. Bibcode: 2015JCli...28.2274P. https://doi.org/10.1175/jcli-d-13-00767.1.
- ↑ Mears, Carl A.; Wentz, Frank J. (2016), "Sensitivity of Satellite-Derived Tropospheric Temperature Trends to the Diurnal Cycle Adjustment", Journal of Climate 29 (10): 3629–3646, doi:10.1175/JCLI-D-15-0744.1, Bibcode: 2016JCli...29.3629M
- ↑ Mears, Carl A.; Wentz, Frank J. (2009), "Construction of the Remote Sensing Systems V3.2 Atmospheric Temperature Records from the MSU and AMSU Microwave Sounders", Journal of Atmospheric and Oceanic Technology 26 (6): 1040–1056, doi:10.1175/2008JTECHA1176.1, Bibcode: 2009JAtOT..26.1040M
- ↑ New RSS TLT V4 - comparisons Moyhu 4 July 2017
- ↑ "Land Surface Temperature Anomaly". 31 December 2019. http://earthobservatory.nasa.gov/GlobalMaps/view.php?d1=MOD_LSTAD_M.
- ↑ "Sea Surface Temperature Anomaly". 31 August 2011. http://earthobservatory.nasa.gov/GlobalMaps/view.php?d1=AMSRE_SSTAn_M.
- ↑ 9.0 9.1 M. J. Schwartz et al., Validation of the Aura Microwave Limb Sounder temperature and geopotential height measurements , JGR: Atmospheres, Vol. 113, No. D15, 16 August 2008. https://doi.org/10.1029/2007JD008783 . Retrieved 9 January 2020.
- ↑ Krishna Rao, P.; Smith, W. L.; Koffler, R. (1972). "Global Sea-Surface Temperature Distribution Determined from an Environmental Satellite". Monthly Weather Review 100 (1): 10–4. doi:10.1175/1520-0493(1972)100<0010:GSTDDF>2.3.CO;2. Bibcode: 1972MWRv..100...10K. https://semanticscholar.org/paper/b6c54a72338f00f45e4989608cb39fa158ef2917. Retrieved 26 November 2019.
- ↑ National Research Council (U.S.). NII 2000 Steering Committee (1997). The unpredictable certainty: information infrastructure through 2000; white papers. National Academies. p. 2. ISBN 9780309060363. https://books.google.com/books?id=qzYrAAAAYAAJ&pg=PA2. Retrieved 25 September 2016.
- ↑ Cynthia Rosenzweig; Daniel Hillel (2008). Climate variability and the global harvest: impacts of El Niño and other oscillations on agroecosystems. Oxford University Press United States. p. 31. ISBN 978-0-19-513763-7. https://books.google.com/books?id=8-UbmSxLWlUC&pg=PA31. Retrieved 25 September 2016.
- ↑ Jin, Menglin (2004). "Analysis of Land Skin Temperature Using AVHRR Observations". Bulletin of the American Meteorological Society 85 (4): 587–600. doi:10.1175/BAMS-85-4-587. Bibcode: 2004BAMS...85..587J. https://semanticscholar.org/paper/a211541bd5e28ae30276aef0d8e3647f3a7ab3ec. Retrieved 26 November 2019.
- ↑ Weng, Qihao (May 2003). "Fractal Analysis of Satellite-Detected Urban Heat Island Effect". Photogrammetric Engineering & Remote Sensing 69 (5): 555–66. doi:10.14358/PERS.69.5.555. http://www.asprs.org/a/publications/pers/2003journal/may/2003_may_555-566.pdf. Retrieved 14 January 2011.
- ↑ Weng, Qihao; Lu, Dengsheng; Schubring, Jacquelyn (2004-02-29). "Estimation of land surface temperature–vegetation abundance relationship for urban heat island studies" (in en). Remote Sensing of Environment 89 (4): 467–483. doi:10.1016/j.rse.2003.11.005. ISSN 0034-4257. https://www.sciencedirect.com/science/article/pii/S0034425703003390.
- ↑ David M. Roth (14 December 2006). "Unified Surface Analysis Manual". Hydrometeorological Prediction Center. p. 19. http://www.wpc.ncep.noaa.gov/sfc/UASfcManualVersion1.pdf.
- ↑ Chris Landsea (8 June 2010). "Subject: H1) What is the Dvorak technique and how is it used?". Atlantic Oceanographic and Meteorological Laboratory. http://www.aoml.noaa.gov/hrd/tcfaq/H1.html.
- ↑ "Greece Suffers More Fires In 2007 Than In Last Decade, Satellites Reveal" (Press release). European Space Agency. 29 August 2007. Archived from the original on 21 February 2021. Retrieved 26 April 2015.
- ↑ Wright, Robert; Flynn, Luke; Garbeil, Harold; Harris, Andrew; Pilger, Eric (2002). "Automated volcanic eruption detection using MODIS". Remote Sensing of Environment 82 (1): 135–55. doi:10.1016/S0034-4257(02)00030-5. Bibcode: 2002RSEnv..82..135W. http://www.higp.hawaii.edu/~wright/rse82.pdf. Retrieved 5 January 2018.
- ↑ Harvey, Chelsea (18 April 2019). "It's A Match: Satellite and Ground Measurements Agree on Warming" , Scientific American. Retrieved 8 January 2019.
- ↑ Lilong Zhao et al. (2016). "Use of SSU/MSU Satellite Observations to Validate Upper Atmospheric Temperature Trends in CMIP5 Simulations ", Remote Sens. 8(1), 13; https://doi.org/10.3390/rs8010013 . Retrieved 12 January 2019
- ↑ http://www.ncdc.noaa.gov/oa/pod-guide/ncdc/docs/podug/html/c4/sec4-2.htm[full citation needed][yes|permanent dead link|dead link}}]
- ↑ Wang, Likun; Zou, Cheng-Zhi; Qian, Haifeng (2012). "Construction of Stratospheric Temperature Data Records from Stratospheric Sounding Units". Journal of Climate 25 (8): 2931–46. doi:10.1175/JCLI-D-11-00350.1. Bibcode: 2012JCli...25.2931W. https://zenodo.org/record/1234597. Retrieved 12 January 2020.
- ↑ Shine, K. P.; Bourqui, M. S.; Forster, P. M. de F.; Hare, S. H. E.; Langematz, U.; Braesicke, P.; Grewe, V.; Ponater, M. et al. (2003). "A comparison of model-simulated trends in stratospheric temperatures". Quarterly Journal of the Royal Meteorological Society 129 (590): 1565–55. doi:10.1256/qj.02.186. Bibcode: 2003QJRMS.129.1565S. https://semanticscholar.org/paper/d062db5479a9bfbbc9b84d58417c276dff3103d3. Retrieved 12 January 2020.
- ↑ "United Nations Environment Programme". http://www.grida.no/climate/ipcc_tar/wg1/fig8-20.htm.
- ↑ Clough, S.A.; M. J. Iacono (1995). "Line-by-line calculation of atmospheric fluxes and cooling rates 2. Application to carbon dioxide, ozone, methane, nitrous oxide and the halocarbons". Journal of Geophysical Research 100 (D8): 16519–16535. doi:10.1029/95JD01386. Bibcode: 1995JGR...10016519C. http://www.agu.org/pubs/crossref/1995/95JD01386.shtml. Retrieved 15 February 2010.
- ↑ 27.0 27.1 Thompson, David W. J.; Solomon, Susan (2009). "Understanding Recent Stratospheric Climate Change". Journal of Climate 22 (8): 1934. doi:10.1175/2008JCLI2482.1. Bibcode: 2009JCli...22.1934T. http://www.atmos.colostate.edu/ao/ThompsonPapers/ThompsonSolomon_JClimate2009.pdf. Retrieved 12 January 2020.
- ↑ Liu, Quanhua; Fuzhong Weng (2009). "Recent Stratospheric Temperature Observed from Satellite Measurements". SOLA 5: 53–56. doi:10.2151/sola.2009-014. Bibcode: 2009SOLA....5...53L.
- ↑ National Environmental Satellite, Data, and Information Service (December 2010). "Microwave Sounding Calibration and Trend". National Oceanic and Atmospheric Administration. http://www.star.nesdis.noaa.gov/smcd/emb/mscat/mscatmain.htm.
- ↑ Remote Sensing Systems
- ↑ Remote Sensing Systems, Upper Air Temperature . Retrieved 12 January 2020.
- ↑ National Oceanic and Atmospheric Administration, Moon: Surface Temperature , retrieved 9 January 2020.
- ↑ NASA/JPL/GSFC/Univ. Oxford (19 May 2011). Taking the Temperature of a Saturn Storm , retrieved 10 January 2020.
External links
- A graph comparing of the surface, balloon and satellite records (2007 archive)
- Temperature Trends in the Lower Atmosphere: Steps for Understanding and Reconciling Differences CCSP Synthesis and Assessment Product 1.1
- What Microwaves Teach Us About the Atmosphere
- Globally Averaged Atmospheric Temperatures
 KSF
KSF

