Inendi Inspector
Topic: Software
 From HandWiki - Reading time: 2 min
 | |
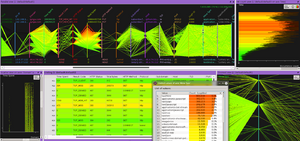
 Screenshot of INENDI Inspector main window | |
| Developer(s) | ENSAM |
|---|---|
| Stable release | 4.9.8
/ May 18, 2022 |
| Written in | C++ |
| Operating system | Linux, Microsoft Windows |
| Platform | x86-64 |
| Size | 516 MB |
| Type | Data analysis, Plotting, Cybersecurity |
| License | MIT |
| Website | gitlab |
INENDI Inspector is an open source visualization software intended to interactively explore large amounts of structured data to find anomalies and weak signals[1].
Description
Supported data visualizations includes parallel coordinates, scatter plots and series.
Current data ingest plugins allows to import data from
- Files (CSV/Text)
- Databases (SQLite, MySQL, PostgreSQL, Elasticsearch)
- Network packet captures (Pcap).
A correlation engine allows to conduct a multidimensional analysis across different datasets.
A Python API is also available to automate various aspect of the analysis.
Multiple CPU and GPU are supported if available.
History
French startup Picviz Labs was created in July 2010[2] to edit its software Picviz Inspector.
In April 2015, ESI Group acquired Picviz Labs assets[3] and relaunched Picviz Inspector as INENDI Inspector[4].
In May 2022, ESI Group in collaboration with ENSAM released the software under the MIT open source license[5].
Awards
Version 3.0, presented at Les Assises de la cybersécurité won the 2012 innovation prize[6][7].
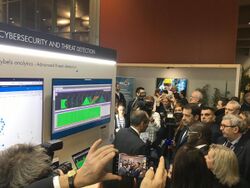
France Cybersecurity Label was awarded during the 2017 Forum on Cybersecurity (FIC)[8][9].

References
- ↑ "The cybercrime process : an overview of scientific challenges and methods, International Journal of Advanced Computer Science and Applications (IJACSA)" (in en). https://thesai.org/Downloads/Volume4No12/Paper_11-The_cybercrime_process_an_overview_of_scientific_challenges_and_methods.pdf.
- ↑ "Picviz Labs" (in fr). https://societeinfo.com/app/recherche/etablissement/52388028400014.
- ↑ "ESI Group to acquire the assets of Picviz Labs" (in en). https://www.esi-group.com/news/esi-group-to-acquire-the-assets-of-picviz-labs-specialist-in-big-data-based-predictive-analysis-through-advanced-visualization.
- ↑ "Cyber Security and Big Data Analytics tool Picviz Inspector Relaunches as INENDI Inspector" (in en). https://www.globalsecuritymag.fr/Cyber-Security-and-Big-Data,20160126,59181.html.
- ↑ "ESI Group, in collaboration with ENSAM, deploys in open source its "Inspector" software" (in en). https://www.esi-group.com/news/esi-group-in-collaboration-with-ensam-deploys-in-open-source-its-inspector-software.
- ↑ "Les Assises - Innovation Prize Laureates" (in en). https://en.lesassisesdelacybersecurite.com/Startups-village/Innovation-Prize.
- ↑ "Prix de l’Innovation des Assises 2012 : Picviz Labs récompensé" (in fr). https://www.globalsecuritymag.fr/Prix-de-l-Innovation-des-Assises,20120618,30876.html.
- ↑ "ESI INENDI Ensures the Cybersecurity of Industrial Networks, Integrating IoT & Machine Learning Technologies" (in en). https://www.esi-group.com/news/esi-inendi-ensures-the-cybersecurity-of-industrial-networks-integrating-iot-machine-learning-technologies.
- ↑ "Label France Cybersecurity 2018 catalog" (in en). https://www.francecybersecurity.fr/wp-content/uploads/2018/01/FCS_Catalogue_2018_web.pdf.
External links
 |
 KSF
KSF