Categories
Economy of Cameroon
 From Wikipedia - Reading time: 13 min
This article was imported from the CIA World Factbook. |
 Douala, the economic capital of Cameroon | |
| Currency | CFA franc (XAF) |
|---|---|
Fiscal year | Calendar year |
Trade organisations | AU, AfCFTA (signed), ECCAS, WTO |
Country group | |
| Statistics | |
| Population | |
| GDP | |
| GDP rank |
|
GDP growth | |
GDP per capita | |
GDP per capita rank |
|
GDP by sector |
|
Inflation (CPI) | 2.2% (2020 est.)[6] |
Population below poverty line | |
Gini coefficient | 46.6 high (2014, World Bank)[9] |
Human Development Index | |
Labour force | |
Labour force by occupation |
|
| Unemployment | 4.3% (2014 est.)[5] |
Main industries | petroleum production and refining, aluminium production, food processing, light consumer goods, textiles, lumber, ship repair |
| External | |
| Exports | |
Export goods | crude oil and petroleum products, lumber, cocoa beans, aluminium, coffee, cotton |
Main export partners |
|
| Imports | |
Import goods | machinery, electrical equipment, transport equipment, fuel, food |
Main import partners |
|
Current account | |
Gross external debt | |
| Public finances | |
Government debt | |
Foreign reserves | |
Budget balance | −3.4% (of GDP) (2017 est.)[5] |
| Revenues | 5.363 billion (2017 est.)[5] |
| Expenses | 6.556 billion (2017 est.)[5] |
| Economic aid | The Paris Club agreed to reduce Cameroon's debt of $1.3 billion by $900 million, debt relief now totals $1.26 billion (2001[update]) |
Credit rating |
|
All values, unless otherwise stated, are in US dollars. | |

The economy of Cameroon was one of the most prosperous in Africa for a quarter of a century after independence. The drop in commodity prices for its principal exports – petroleum, cocoa, coffee, and cotton – in the mid-1980s, combined with an overvalued currency and economic mismanagement, led to a decade-long recession. Real per capita GDP fell by more than 60% from 1986 to 1994. The current account and fiscal deficits widened, and foreign debt grew. Yet because of its oil reserves and favorable agricultural conditions, Cameroon still has one of the best-endowed primary commodity economies in sub-Saharan Africa.[15]
Agriculture
[edit]This section needs to be updated. (August 2024) |
In 2018, Cameroon produced:
- 5 million tons of cassava (13th largest producer in the world);
- 3.9 million tonnes of plantain (3rd largest producer in the world, only behind Congo and Ghana);
- 2.6 million tons of palm oil (7th largest producer in the world);
- 2.3 million tons of maize;
- 1.9 million tons of taro (3rd largest producer in the world, second only to Nigeria and China);
- 1.4 million tons of sorghum;
- 1.2 million tons of banana;
- 1.2 million tons of sugarcane;
- 1 million tons of tomato (19th largest producer in the world);
- 674,000 tonnes of yam (7th largest producer in the world);
- 594,000 tons of peanut;
- 410,000 tons of sweet potato;
- 402,000 tons of beans;
- 332,000 tons of rice;
- 310,000 tons of pineapple;
- 307,000 tons of cocoa (5th largest producer in the world, after Ivory Coast, Ghana, Indonesia and Nigeria);
- 302,000 tons of potato;
- 301,000 tons of onion;
- 249,000 tons of cotton.
In addition to smaller productions of other agricultural products, such as coffee (33,000 tons) and natural rubber (55,000 tons).[16]
Finance and banking
[edit]Cameroon's financial system is the largest in the CEMAC region. Access to financial services is limited, particularly for SMEs. Aside from a traditional tendency for banks to prefer dealing with large, established companies, determining factors are also found in interest rates for loans to SMEs being capped at 15 percent and being heavily taxed. As of 2006, bank loans to SMEs hardly reached 15 percent of total outstanding loans (Molua, 2002).[15]
Less than 5 percent of Cameroonians have access to a bank account. While the microfinance sector is consequently becoming increasingly important, its development is hampered by a loose regulatory and supervisory framework for microfinance institutions (MFIs). The banking sector is highly concentrated and dominated by foreign commercial banks. 6 out of the 11 largest commercial banks are foreign-owned, and the three largest banks hold more than 50 percent of total financial system assets. While foreign banks generally display good solvency ratios, small domestic banks are in a much weaker position. Their capitalization is well below the average of banks in the CEMAC region and their profits are close to 2 percent, compared to 20 percent for foreign banks in the country. This is partially explained by the high levels of non-performing loans, which reached 12 percent in 2007, leading to most banks holding large amounts of excess reserves as a percentage of deposits and large levels of unutilized liquidity.[17]
In 2018, Cameroon's financial system is being requested by the International Monetary Fund (IMF) to increase its tax base to cover the losses from the North-West and South-West Cameroon's regions instabilities, the loss of oil revenue, the failure to deliver on port facilities, and the decline in oil production from mature oil fields.[18]
Macro-economic trend
[edit]Cameroon became an oil-producing country in 1977. Claiming to want to make reserves for difficult times, the authorities manage "off-budget" oil revenues in total opacity (the funds are placed in Paris, Switzerland and New York accounts). Several billion dollars are thus diverted to the benefit of oil companies and regime officials. The influence of France and its 9,000 nationals in Cameroon remains considerable. African Affairs magazine noted in the early 1980s that they "continue to dominate almost all key sectors of the economy, much as they did before independence. French nationals control 55% of the modern sector of the Cameroonian economy and their control over the banking system is total.[19]
Recent signs, however, are encouraging. As of March 1998, Cameroon's fifth IMF program – a 3-year enhanced structural adjustment program approved in August 1997 – is on track. Cameroon has rescheduled its Paris Club debt at favorable terms. GDP has grown by about 5% a year beginning in 1995. There is cautious optimism that Cameroon is emerging from its long period of economic hardship.

The Enhanced Structural Adjustment Facility (ESAF) signed recently by the IMF and Government of Cameroon calls for greater macroeconomic planning and financial accountability; privatization of most of Cameroon's nearly 100 remaining non-financial parastatal enterprises; elimination of state marketing board monopolies on the export of cocoa, certain coffees, and cotton; privatization and price competition in the banking sector; implementation of the 1992 labor code; a vastly improved judicial system; and political liberalization to boost investment.
France is Cameroon's main trading partner and source of private investment and foreign aid. Cameroon has an investment guaranty agreement and a bilateral accord with the United States. USA investment in Cameroon is about $1 million, most of it in the oil sector. Inflation has been brought back under control. Cameroon aims at becoming emerging by 2035.
The government embarked upon a series of economic reform programs supported by the World Bank and International Monetary Fund (IMF) beginning in the late 1980s. Many of these measures have been painful; the government slashed civil service salaries by 65% in 1993. The CFA franc – the common currency of Cameroon and 13 other African states – was devalued by 50% in January 1994. The government failed to meet the conditions of the first four IMF programs.
This is a chart of trend of gross domestic product of Cameroon at market prices estimated by the International Monetary Fund with figures in millions of Central African CFA Francs.

| Year | Gross Domestic Product | US Dollar Exchange |
|---|---|---|
| 1980 | 1,600,186 | 209.20 Francs |
| 1985 | 4,355,977 | 471.12 Francs |
| 1990 | 3,804,428 | 300.65 Francs |
| 1995 | 4,686,286 | 518.62 Francs |
| 2000 | 6,612,385 | 658.21 Francs |
| 2005 | 8,959,279 | 527.29 Francs |
The following table shows the main economic indicators in 1980–2022. Inflation below 5% is in green.[20]
| Year | GDP
(in Bil. US$PPP) |
GDP per capita
(in US$ PPP) |
GDP
(in Bil. US$nominal) |
GDP growth
(real) |
Inflation rate
(in Percent) |
Government debt
(in % of GDP) |
|---|---|---|---|---|---|---|
| 1980 | 11.1 | 1,263 | 8.85 | n/a | ||
| 1981 | n/a | |||||
| 1982 | n/a | |||||
| 1983 | n/a | |||||
| 1984 | n/a | |||||
| 1985 | n/a | |||||
| 1986 | n/a | |||||
| 1987 | n/a | |||||
| 1988 | n/a | |||||
| 1989 | n/a | |||||
| 1990 | n/a | |||||
| 1991 | n/a | |||||
| 1992 | n/a | |||||
| 1993 | n/a | |||||
| 1994 | n/a | |||||
| 1995 | n/a | |||||
| 1996 | n/a | |||||
| 1997 | n/a | |||||
| 1998 | 68% | |||||
| 1999 | ||||||
| 2000 | ||||||
| 2001 | ||||||
| 2002 | ||||||
| 2003 | ||||||
| 2004 | ||||||
| 2005 | ||||||
| 2006 | ||||||
| 2007 | ||||||
| 2008 | ||||||
| 2009 | ||||||
| 2010 | ||||||
| 2011 | ||||||
| 2012 | ||||||
| 2013 | ||||||
| 2014 | ||||||
| 2015 | ||||||
| 2016 | ||||||
| 2017 | ||||||
| 2018 | ||||||
| 2019 | ||||||
| 2020 | ||||||
| 2021 | ||||||
| 2022 |
Mining
[edit]Gallery
[edit]-
 Douala
 -
 A touristic area in Limbe
 -
 Yaoundé Sport palace
 -
 A Fulani herder drives his cattle in northern Cameroon.
 -
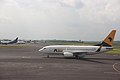 Douala International Airport
 -
 Intercity buses in transit during the night (Touristique Express)
 -
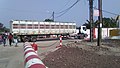
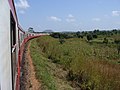 Interurban passenger train on the move in Cameroon (Douala-Yaounde-Ngaoundere)
 -
 Douala Seaport
 -
 A truck transporting beers to various localities in Cameroon
See also
[edit]- Cameroon
- Transport in Cameroon
- United Nations Economic Commission for Africa
References
[edit]- ^ "World Economic Outlook Database, April 2019". IMF.org. International Monetary Fund. Retrieved 29 September 2019.
- ^ "World Bank Country and Lending Groups". datahelpdesk.worldbank.org. World Bank. Retrieved 29 September 2019.
- ^ "Population, total". data.worldbank.org. World Bank. Retrieved 23 August 2019.
- ^ a b c d e f g h "IMF DataMapper: Cameroon". International Monetary Fund. 2025. Retrieved 31 May 2025.
- ^ a b c d e f g h i j k l m n "Cameroon". The World Factbook (2025 ed.). Central Intelligence Agency. Retrieved 8 February 2019. (Archived 2019 edition.)
- ^ "World Economic Outlook Database, October 2019". IMF.org. International Monetary Fund. Retrieved 6 December 2019.
- ^ "Poverty headcount ratio at national poverty lines (% of population)". data.worldbank.org. World Bank. Retrieved 11 February 2019.
- ^ "Poverty headcount ratio at $3.20 a day (2011 PPP) (% of population) - Cameroon". data.worldbank.org. World Bank. Retrieved 16 March 2020.
- ^ "GINI index (World Bank estimate)". data.worldbank.org. World Bank. Retrieved 11 February 2019.
- ^ "Human Development Index (HDI)". hdr.undp.org. HDRO (Human Development Report Office) United Nations Development Programme. Retrieved 11 December 2019.
- ^ "Inequality-adjusted Human Development Index (IHDI)". hdr.undp.org. HDRO (Human Development Report Office) United Nations Development Programme. Retrieved 11 December 2019.
- ^ "Labor force, total". data.worldbank.org. World Bank. Retrieved 23 August 2019.
- ^ "Employment to population ratio, 15+, total (%) (national estimate) - Cameroon". data.worldbank.org. World Bank. Retrieved 24 November 2019.
- ^ "Sovereigns rating list". Standard & Poor's. Retrieved 26 May 2011.
- ^ a b Tambi, Mbu Daniel (30 March 2015). "Economic Growth, Crisis, and Recovery in Cameroon: A Literature Review". Journal of Industrial Distribution & Business. 6 (1): 5–15. doi:10.13106/ijidb.2015.vol6.no1.5.
{{cite journal}}: CS1 maint: ignored DOI errors (link) - ^ Cameroon production in 2018, by FAO
- ^ "Cameroon Financial Sector Profile: MFW4A - Making Finance Work for Africa". www.mfw4a.org. Archived from the original on 13 May 2011. Retrieved 1 December 2010.
- ^ IMF.org
- ^ Thomas Deltombe, Manuel Domergue, Jacob Tatsita, Kamerun !, La Découverte, 2019
- ^ "Report for Selected Countries and Subjects". Retrieved 29 August 2018.
External links
[edit]World Trade Organization | |||
|---|---|---|---|
| System |
| ||
| Issues |
| ||
| Agreements |
| ||
| Ministerial Conferences |
| ||
| People |
| ||
| Members |
| ||
| |||
Original source: https://en.wikipedia.org/wiki/Economy of Cameroon
Status: article is cached
 EncycloReader
is supported by the
EncycloReader
is supported by the