Categories
Maryland Legislative District 30
 From Wikipedia - Reading time: 6 min
| Maryland's legislative district 30 | |
|---|---|
| Represents part of Anne Arundel County | |
 | |
| Senator | Shaneka T. Henson (D) |
| Delegate(s) |
|
| Registration |
|
| Demographics |
|
| Population (2020) | 124,623 |
| Voting-age population | 99,393 |
| Registered voters | 91,447 |
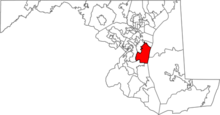
Maryland's Legislative District 30 is one of 47 districts in the state for the Maryland General Assembly. It covers part of Anne Arundel County, Maryland, it is home to Maryland's capital; the city of Annapolis. Until the 2010 census and subsequent redistricting, voters in this district selected three Delegates every four years to represent them in the Maryland House of Delegates. Starting with the 2014 election, the district was divided into sub-districts 30A and 30B.[1][citation needed]
Demographic characteristics
[edit]As of the 2020 United States census, the district had a population of 124,623, of whom 99,393 (79.8%) were of voting age. The racial makeup of the district was 88,997 (71.4%) White, 14,596 (11.7%) African American, 566 (0.5%) Native American, 2,581 (2.1%) Asian, 57 (0.0%) Pacific Islander, 8,570 (6.9%) from some other race, and 9,265 (7.4%) from two or more races.[2][3] Hispanic or Latino of any race were 15,170 (12.2%) of the population.[4]
The district had 91,447 registered voters as of October 17, 2020, of whom 19,573 (21.4%) were registered as unaffiliated, 31,047 (34.0%) were registered as Republicans, 39,609 (43.3%) were registered as Democrats, and 629 (0.7%) were registered to other parties.[5]
Political representation
[edit]The district is represented for the 2023–2027 legislative term in the State Senate by Shaneka T. Henson (D) and in the House of Delegates by Dana C. Jones (D, District 30A), Dylan Behler (D, District 30A), and Seth A. Howard (R, District 30B).[6][7]
Past election results
[edit]| Name | Votes | Percent | Outcome |
|---|---|---|---|
| Ron George, Rep. | 25,631 | 19.25% | Won |
| Michael E. Busch, Dem. | 23,995 | 18.02% | Won |
| Herb McMillan, Rep. | 22,553 | 16.94% | Won |
| Virginia P. Clagett, Dem. | 21,142 | 15.88% | Lost |
| Seth Howard, Rep. | 20,080 | 15.08% | Lost |
| Judd Legum, Dem. | 19,670 | 14.77% | Lost |
| Name | Votes | Percent | Outcome |
|---|---|---|---|
| Michael E. Busch, Dem. | 22,479 | 17.1% | Won |
| Virginia P. Clagett, Dem. | 22,360 | 17.0% | Won |
| Ron George, Rep. | 21,811 | 16.6% | Won |
| Barbara Samorajczyk, Dem. | 21,758 | 16.5% | Lost |
| Andy Smarick, Rep. | 20,594 | 15.6% | Lost |
| Ron Elfenbein, Rep. | 20,497 | 15.5% | Lost |
| Name | Votes | Percent | Outcome |
|---|---|---|---|
| Michael E. Busch, Dem. | 22,422 | 17.7% | Won |
| Virginia P. Clagett, Dem. | 21,875 | 17.3% | Won |
| Herbert H. McMillan, Rep. | 20,972 | 16.6% | Won |
| C. Richard D'Amato, Dem. | 20,545 | 16.3% | Lost |
| Michael Collins, Rep. | 19,140 | 15.1% | Lost |
| Nancy Almgren, Rep. | 18,861 | 14.9% | Lost |
| David M. Gross, Green | 2,536 | 2.0% | Lost |
| Other Write-Ins | 71 | 0.1% |
| Name | Votes | Percent | Outcome |
|---|---|---|---|
| Michael E. Busch, Dem. | 24,075 | 21% | Won |
| Virginia P. Clagett, Dem. | 24,036 | 21% | Won |
| C. Richard D'Amato, Dem. | 20,223 | 18% | Won |
| Phillip D. Bissett, Rep. | 18,690 | 16% | Lost |
| Edward J. Turner, Rep. | 14,119 | 12% | Lost |
| Anthony McConkey, Rep. | 12,353 | 11% | Lost |
| Name | Votes | Percent | Outcome |
|---|---|---|---|
| Michael E. Busch, Dem. | 18,709 | 19% | Won |
| Phillip D. Bissett, Rep. | 18,009 | 23% | Won |
| Virginia P. Clagett, Dem. | 18,254 | 18% | Won |
| Ralph C. Rosacker, Rep. | 16,299 | 16% | Lost |
| Joan Beck, Rep. | 15,974 | 16% | Lost |
| John C. Eldridge Jr., Dem. | 13,320 | 13% | Lost |
| Name | Votes | Percent | Outcome |
|---|---|---|---|
| John Astle, Dem. | 18,009 | 23% | Won |
| Aris T. Allen, Rep. | 16,951 | 22% | Won |
| Michael E. Busch, Dem. | 16,104 | 18% | Won |
| Edith Segree, Dem. | 14,341 | 18% | Lost |
| Phillip D. Bissett, Rep. | 13,321 | 17% | Lost |
References
[edit]- ^ "LEGISLATIVE DISTRICTING PLAN OF 2012 - LEGISLATIVE DISTRICT 30". Maryland State Archives. March 29, 2018. Retrieved October 16, 2021.
- ^ "RACE". United States Census Bureau. Retrieved October 17, 2021.
- ^ "RACE FOR THE POPULATION 18 YEARS AND OVER". United States Census Bureau. Retrieved October 17, 2021.
- ^ "HISPANIC OR LATINO, AND NOT HISPANIC OR LATINO BY RACE". United States Census Bureau. Retrieved October 17, 2021.
- ^ "2020 Presidential General Voter Registration Counts as of Close of Registration, By Legislative". Maryland State Archives. October 17, 2020. Retrieved October 15, 2021.
- ^ "Maryland Senators By District". Maryland State Archives. January 28, 2023. Retrieved January 8, 2025.
- ^ "Maryland Delegates By District". Maryland State Archives. January 28, 2023. Retrieved January 8, 2025.
- ^ "2010 General Election Official Results". Maryland State Board of Elections. Retrieved August 13, 2012.
- ^ "Official 2007 Gubernatorial General Election results for Anne Arundel County". Maryland State Board of Elections. Retrieved January 20, 2008.
- ^ "House of Delegates Results". Maryland State Board of Elections. Retrieved on Jan, 20th, 2008
- ^ "House of Delegates Results". Maryland State Board of Elections. Retrieved on Nov. 7, 2007
- ^ "House of Delegates Results". Maryland State Board of Elections. Retrieved on Nov. 7, 2007
- ^ "House of Delegates Results". Maryland State Board of Elections. Retrieved on Nov. 7, 2007
Original source: https://en.wikipedia.org/wiki/Maryland Legislative District 30
Status: article is cached
 EncycloReader
is supported by the
EncycloReader
is supported by the