Pulmonary embolism electrocardiogram
 From Wikidoc - Reading time: 5 min
| Resident Survival Guide |
|
Pulmonary Embolism Microchapters |
|
Diagnosis |
|---|
|
Pulmonary Embolism Assessment of Probability of Subsequent VTE and Risk Scores |
|
Treatment |
|
Follow-Up |
|
Special Scenario |
|
Trials |
|
Case Studies |
|
Pulmonary embolism electrocardiogram On the Web |
|
Directions to Hospitals Treating Pulmonary embolism electrocardiogram |
|
Risk calculators and risk factors for Pulmonary embolism electrocardiogram |
Editor(s)-In-Chief: C. Michael Gibson, M.S., M.D. [1], The APEX Trial Investigators; Associate Editor(s)-in-Chief: Rim Halaby, M.D. [2]
Overview[edit | edit source]
The electrocardiogram (ECG) in the cases of pulmonary embolism (PE) is often abnormal; however, the ECG abnormalities are neither sensitive nor specific.[1][2] Some of the most common ECG abnormalities in PE include T wave inversion in the anterior leads and sinus tachycardia.[3][4][2] The ECG abnormalities reported in PE are also present in a variety of other conditions rendering the utility of ECG for the diagnosis of PE limited. Nevertheless, an ECG is routinely performed in all patients with suspected PE in order to rule out other differential diagnoses such as myocardial infarction.
Electrocardiogram[edit | edit source]
Various ECG abnormalities are reported in PE patients; however, the ECG findings lack sensitivity and specificity for PE. T wave inversion in the anterior leads has been reported in many studies as the most common ECG finding among patients with PE, particularly massive PE.[3][4][2] In addition, the development of a Qr wave in lead V1 has been reported as as an independent correlate of adverse prognosis.[5]
Complete List of ECG Findings[edit | edit source]
Shown below is a list of ECG findings in PE:[6][3][4][2]
- T wave inversion in the anterior leads (one of the most common findings, particularly in massive PE)
- Sinus tachycardia (one of the most common findings)
- Incomplete RBBB
- Complete RBBB
- S1Q3T3
- Right axis deviation
- ST segment and T wave non specific changes[7]
- P pulmonale[7]
- Low QRS voltage
- Normal heart rhythm
- ST elevation (rare)[8]
- Q waves in the anterior leads (rare)[9]
Shown below is a table summarizing the rate of occurrence of a variety of ECG findings in PE according to three different studies.
| ECG Findings | Study 1[3] | Study 2[4] | Study 3[2] |
| T wave inversion | 68% | 42% | 44.4% |
| Sinus tachycardia | 26% | 69% | 42.2% |
| RBBB | 22% | 15% | 4.4%-6.7% |
| S1Q3T3 | 50% | 12% | 11.6% |
| P pulmonale | 5% | 6% | 2.2% |
| Normal heart rhythm | 9% | 13% | - |
T Wave Inversion[edit | edit source]
T wave inversion in the anterior leads has been reported in many studies as the most common ECG finding among patients with PE, particularly massive PE.[3][4][2] T wave inversion in the anterior leads represent reciprocal changes related to infero-posterior ischemia due to compression of the right coronary artery (RCA), caused by pressure overload in the right ventricle following an acute PE.[10]
Cor Pulmonale and Right Heart Strain[edit | edit source]
Signs of right heart strain or acute cor pulmonale may be present in patients with a massive PE. The classic sign S1Q3T3 is characterized by the presence of a large S wave in lead I, a large Q wave in lead III and an inverted T wave in lead III .[11][12] S1Q3T3 is a sign of acute cor pulmonale that can be present in conditions other than PE.
Electrocardiographic Examples[edit | edit source]
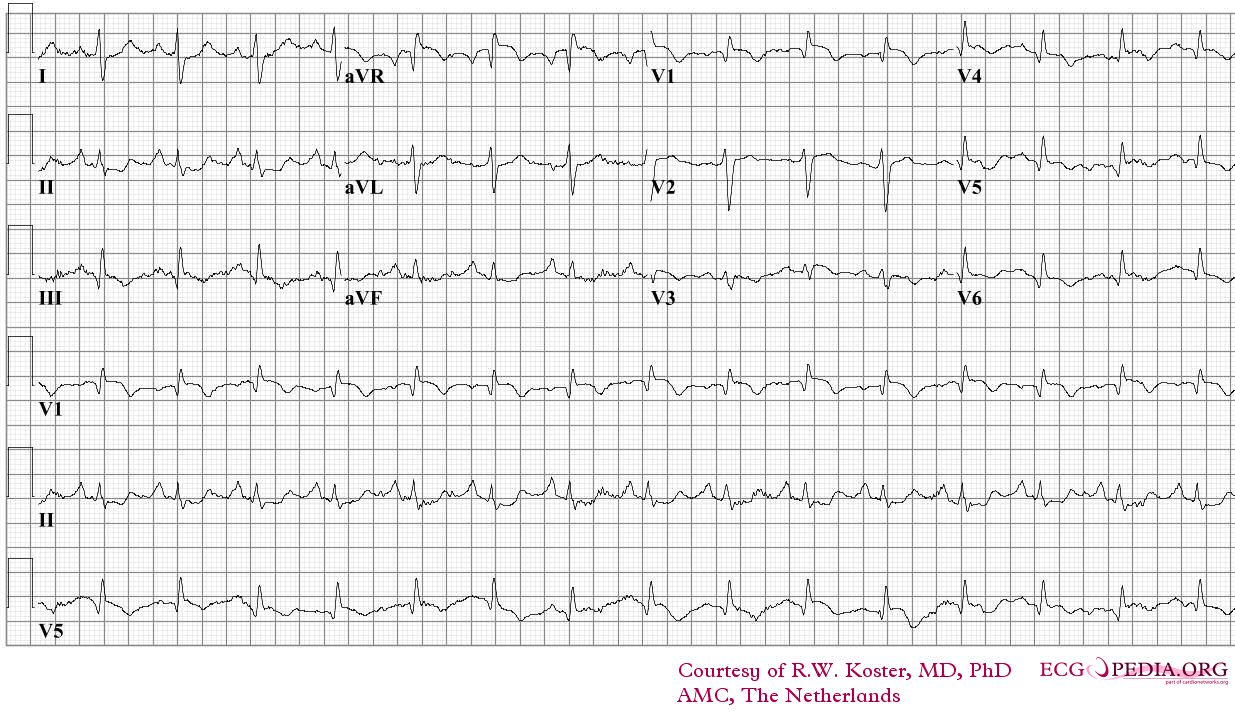
Shown below is an EKG of a patient with a pulmonary embolism:

Copyleft image obtained courtesy of ECGpedia ecgpedia
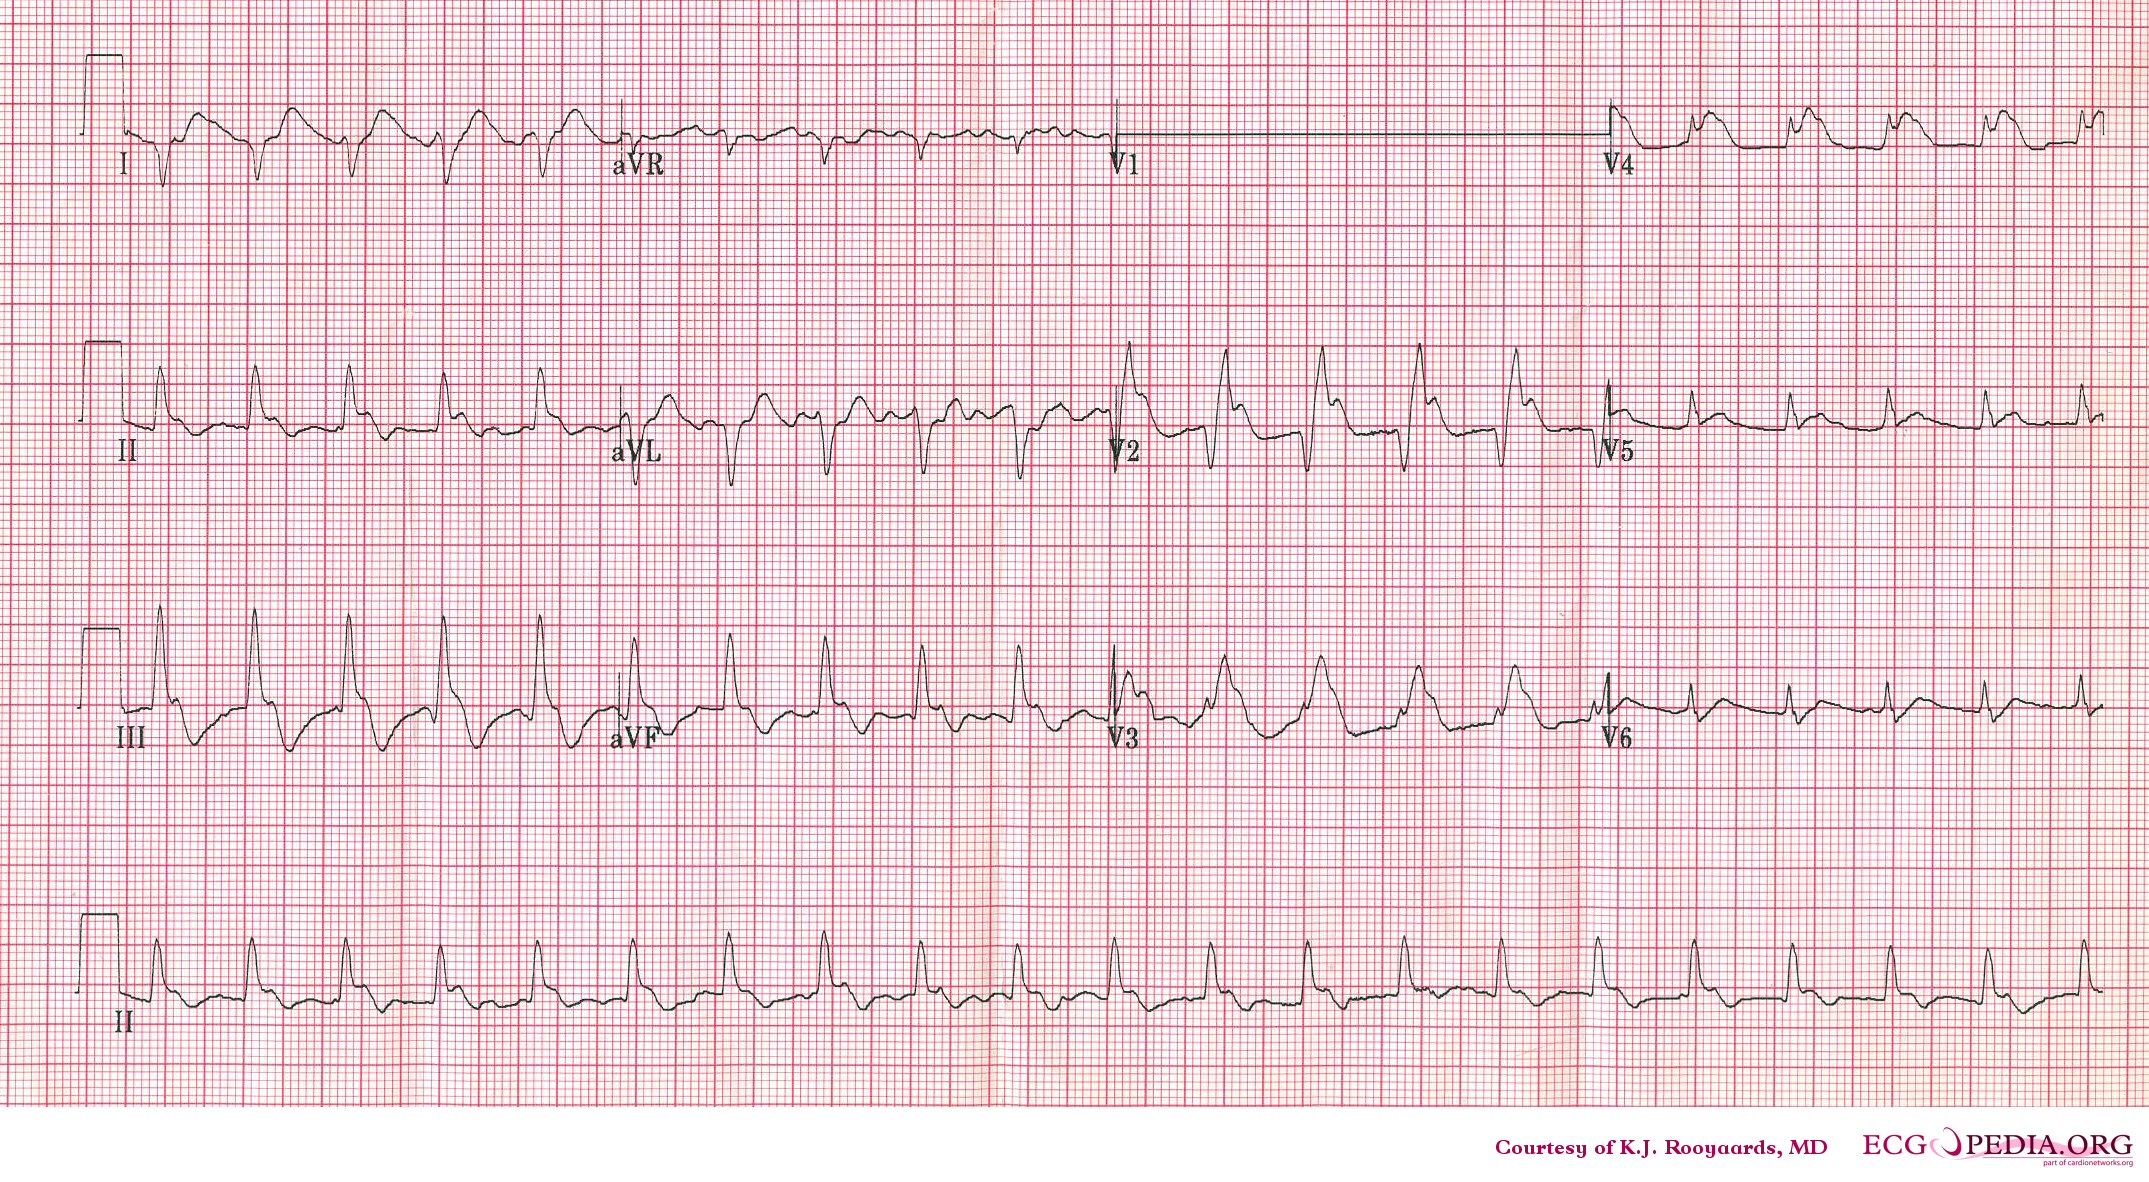
Shown below is an EKG of a patient with a pulmonary embolism:

Copyleft image obtained courtesy of ECGpedia ecgpedia
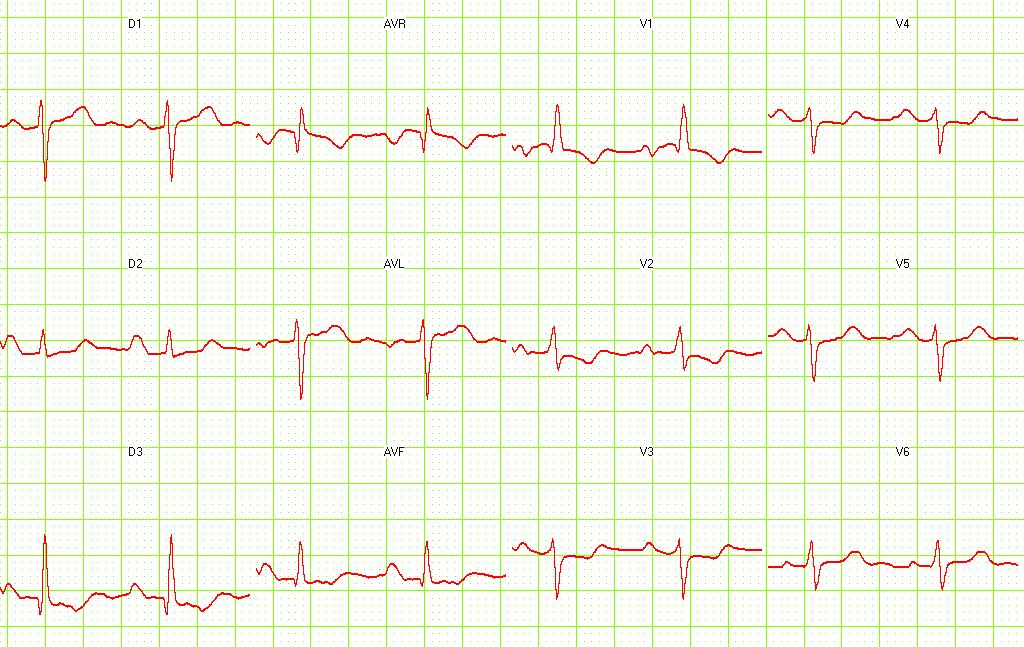
Shown below is an EKG of a patient with a pulmonary embolism:

Image courtesy of Dr Jose Ganseman Dr Ganseman's webpage: An ultimate source of EKG
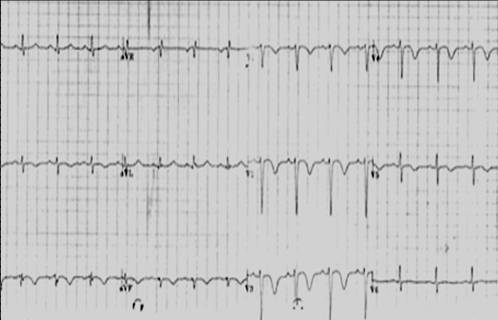
Shown below is an EKG of a patient with a pulmonary embolism:

Image obtained courtesy of Amal Mattu, M.D.
Shown below is an EKG of a patient with a pulmonary embolism:

Image obtained courtesy of Amal Mattu, M.D.
References[edit | edit source]
- ↑ Geibel A, Zehender M, Kasper W, Olschewski M, Klima C, Konstantinides SV (2005). "Prognostic value of the ECG on admission in patients with acute major pulmonary embolism". Eur Respir J. 25 (5): 843–8. doi:10.1183/09031936.05.00119704. PMID 15863641.
- ↑ 2.0 2.1 2.2 2.3 2.4 2.5 Rodger M, Makropoulos D, Turek M, Quevillon J, Raymond F, Rasuli P; et al. (2000). "Diagnostic value of the electrocardiogram in suspected pulmonary embolism". Am J Cardiol. 86 (7): 807–9, A10. PMID 11018210.
- ↑ 3.0 3.1 3.2 3.3 3.4 Ferrari E, Imbert A, Chevalier T, Mihoubi A, Morand P, Baudouy M (1997). "The ECG in pulmonary embolism. Predictive value of negative T waves in precordial leads--80 case reports". Chest. 111 (3): 537–43. PMID 9118684.
- ↑ 4.0 4.1 4.2 4.3 4.4 Stein PD, Dalen JE, McIntyre KM, Sasahara AA, Wenger NK, Willis PW (1975). "The electrocardiogram in acute pulmonary embolism". Prog Cardiovasc Dis. 17 (4): 247–57. PMID 123074.
- ↑ Kucher N, Walpoth N, Wustmann K, Noveanu M, Gertsch M (2003). "QR in V1--an ECG sign associated with right ventricular strain and adverse clinical outcome in pulmonary embolism". European Heart Journal. 24 (12): 1113–9. PMID 12804925. Retrieved 2011-12-05. Unknown parameter
|month=ignored (help) - ↑ Richman PB, Loutfi H, Lester SJ, Cambell P, Matthews J, Friese J; et al. (2004). "Electrocardiographic findings in Emergency Department patients with pulmonary embolism". J Emerg Med. 27 (2): 121–6. doi:10.1016/j.jemermed.2004.04.007. PMID 15261352.
- ↑ 7.0 7.1 Todd K, Simpson CS, Redfearn DP, Abdollah H, Baranchuk A (2009). "ECG for the diagnosis of pulmonary embolism when conventional imaging cannot be utilized: a case report and review of the literature". Indian Pacing Electrophysiol J. 9 (5): 268–75. PMC 2735159. PMID 19763195.
- ↑ Mohsen A, El-Kersh K (2013). "Variable ECG findings associated with pulmonary embolism". BMJ Case Rep. 2013. doi:10.1136/bcr-2013-008697. PMID 23449833.
- ↑ Raghav KP, Makkuni P, Figueredo VM (2011). "A review of electrocardiography in pulmonary embolism: recognizing pulmonary embolus masquerading as ST-elevation myocardial infarction". Rev Cardiovasc Med. 12 (3): 157–63. PMID 22145193.
|access-date=requires|url=(help) - ↑ Goldhaber SZ (1998). "Pulmonary embolism". N Engl J Med. 339 (2): 93–104. doi:10.1056/NEJM199807093390207. PMID 9654541.
- ↑ McGinn S, White PD. Acutecor pulmonale resulting from pulmonary embolism. J Am Med Assoc 1935;104:1473–1480.
- ↑ Panos RJ, Barish RA, Whye DW, Groleau G (1988). "The electrocardiographic manifestations of pulmonary embolism". J Emerg Med. 6 (4): 301–7. PMID 3225435.
 KSF
KSF