2010 Georgia gubernatorial election
 From Wikipedia - Reading time: 11 min
| |||||||||||||||||
| |||||||||||||||||
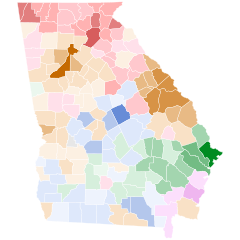
Deal: 40–50% 50–60% 60–70% 70–80% 80–90% >90% Barnes: 40–50% 50–60% 60–70% 70–80% 80–90% >90% Tie: 40–50% 50% No data | |||||||||||||||||
| |||||||||||||||||
| Elections in Georgia |
|---|
 |
The 2010 Georgia gubernatorial election was held on November 2, 2010. Incumbent Republican governor Sonny Perdue was term-limited and unable to seek re-election. Primary elections for the Republican and Democratic parties took place on July 20. Democrats nominated former governor Roy Barnes, and Republicans nominated Representative Nathan Deal following a runoff on August 10. The Libertarian Party also had ballot access and nominated John Monds. Deal won the general election, and took office on January 10, 2011.[1]
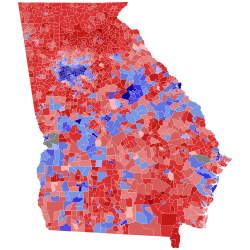
As of 2024[update], this was the last election in which a candidate won the governorship by double digits. This is the first gubernatorial election in Georgia since 1990 in which the winner was of a different party than the incumbent president. This was the first election in which Republicans won three consecutive gubernatorial elections in the state. This was the last gubernatorial election in which Douglas, Henry, and Newton counties voted for the Republican candidate and the last in which Baker, Early, Mitchell, Peach, Clinch, Brooks, and McIntosh counties voted for the Democratic candidate.
Republican primary
[edit]Candidates
[edit]Declared
[edit]- Jeff Chapman, State Senator
- Nathan Deal, U.S. representative[2]
- Karen Handel, Secretary of State of Georgia
- Eric Johnson, former state senator
- Ray McBerry, candidate for governor in 2006
- John Oxendine, insurance commissioner
- Otis Putnam
Declined
[edit]- Johnny Isakson, incumbent U.S. senator[3]
Polling
[edit]Primary
[edit]| Poll source | Dates administered | John Oxendine |
Karen Handel |
Nathan Deal |
Eric Johnson |
Ray McBerry |
Austin Scott |
Jeff Chapman |
Undecided |
|---|---|---|---|---|---|---|---|---|---|
| Magellan Strategies[4] | July 18, 2010 | 12% | 38% | 20% | 17% | 3% | – | 3% | 7% |
| InsiderAdvantage[5] | July 14, 2010 | 15% | 24% | 16% | 13% | 3% | – | 6% | 22% |
| Rasmussen Reports[6] | July 13, 2010 | 20% | 25% | 25% | 13% | – | – | – | 14% |
| Mason-Dixon[7] | July 8–13, 2010 | 31% | 23% | 18% | 6% | 2% | – | 1% | 19% |
| Magellan Strategies[8] | July 8, 2010 | 18% | 32% | 18% | 8% | 3% | – | 3% | 14% |
| Survey USA[9] | July 7–8, 2010 | 32% | 23% | 12% | 12% | 5% | – | 4% | 10% |
| InsiderAdvantage[10] | July 1, 2010 | 18% | 18% | 12% | 8% | 3% | – | 6% | 34% |
| Survey USA[11] | June 14–17, 2010 | 34% | 18% | 17% | 6% | 3% | – | 4% | 17% |
| InsiderAdvantage[12] | April 5, 2010 | 26% | 18% | 9% | 5% | – | – | – | 31% |
| Rasmussen Reports[13] | December 15, 2009 | 28% | 14% | 13% | 2% | 2% | 2% | 2% | 32% |
| Rasmussen Reports[14] | October 20, 2009 | 27% | 12% | 9% | 3% | 3% | 3% | -- | 35% |
| Rasmussen Reports[15] | August 18, 2009 | 31% | 13% | 13% | 3% | 2% | -- | -- | 31% |
| Rasmussen Reports[16] | June 17, 2009 | 33% | 11% | 10% | 3% | 2% | 2% | -- | 33% |
| Strategic Vision[17] | June 17, 2009 | 35% | 13% | 12% | 4% | 2% | 2% | -- | 32% |
Runoff
[edit]| Poll source | Dates administered | Nathan Deal |
Karen Handel |
|---|---|---|---|
| Landmark Communications[18] | August 7, 2010 | 44% | 42% |
| Georgia Newspapers[19] | August 7, 2010 | 42% | 47% |
| Insider Advantage[20] | August 5, 2010 | 46% | 46% |
| Landmark Communications[21] | August 2, 2010 | 37% | 46% |
| McLaughlin & Associates[22] | July 23, 2010 | 39% | 38% |
Results
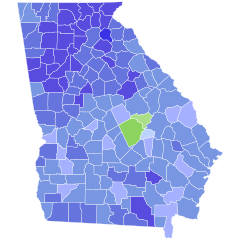
[edit]
- 20–30%
- 30–40%
- 40–50%
- 50–60%
- 60–70%
- 20–30%
- 30–40%
- 40–50%
- 50–60%
- 60–70%
- 20–30%
- 30–40%
- 40–50%
- 50–60%
- 60–70%
- 20–30%
- 30–40%
- 40–50%
- 60–70%
- 30–40%
- 40–50%
- 30–40%
| Party | Candidate | Votes | % | |
|---|---|---|---|---|
| Republican | Karen Handel | 231,990 | 34.1 | |
| Republican | Nathan Deal | 155,946 | 22.9 | |
| Republican | Eric Johnson | 136,792 | 20.1 | |
| Republican | John Oxendine | 115,421 | 17.0 | |
| Republican | Jeff Chapman | 20,636 | 3.0 | |
| Republican | Ray McBerry | 17,171 | 2.5 | |
| Republican | Otis Putnam | 2,543 | 0.4 | |
| Total votes | 680,499 | 100.0 | ||

- 50–60%
- 60–70%
- 70–80%
- 80–90%
- 50–60%
- 60–70%
- 70–80%
- 50%
| Party | Candidate | Votes | % | |
|---|---|---|---|---|
| Republican | Nathan Deal | 291,035 | 50.2 | |
| Republican | Karen Handel | 288,516 | 49.8 | |
| Total votes | 579,551 | 100.0 | ||
Democratic primary
[edit]Candidates
[edit]Declared
[edit]- Thurbert Baker, Attorney General of Georgia
- Roy Barnes, former governor of Georgia[25]
- Bill Bolton
- Carl Camon
- Randal Mangham, state representative
- DuBose Porter, state representative
- David Poythress, former adjutant general of the Georgia National Guard, former commissioner of labor and candidate for governor in 1998
Polling
[edit]| Poll source | Dates administered | Roy Barnes |
Thurbert Baker |
DuBose Porter |
Carl Camon |
David Poythress |
Undecided |
|---|---|---|---|---|---|---|---|
| Rasmussen Reports[26] | July 13, 2010 | 59% | 16% | 5% | -- | 5% | 12% |
| Mason-Dixon[7] | July 8–13, 2010 | 54% | 20% | 3% | -- | 7% | 16% |
| Survey USA[9] | July 7–8, 2010 | 56% | 18% | 6% | 3% | 5% | 9% |
| Survey USA[11] | June 14–17, 2010 | 63% | 13% | 4% | 1% | 5% | 11% |
| InsiderAdvantage[27] | April 7, 2010 | 47% | 18% | 5% | – | 6% | 24% |
| Rasmussen Reports[28] | December 18, 2009 | 48% | 17% | 3% | 1% | 4% | 19% |
| Rasmussen Reports[29] | October 20, 2009 | 43% | 19% | 4% | 3% | 4% | 21% |
| Rasmussen Reports[30] | August 18, 2009 | 42% | 9% | 7% | 1% | 2% | 30% |
| Rasmussen Reports[31] | June 17, 2009 | 48% | 8% | 5% | 2% | 2% | 31% |
| Strategic Vision[17] | June 17, 2009 | 49% | 30% | 2% | - | 5% | 14% |
Results
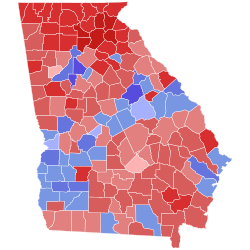
[edit]
- 30–40%
- 40–50%
- 50–60%
- 60–70%
- 70–80%
- 80–90%
- 50–60%
- 60–70%
| Party | Candidate | Votes | % | |
|---|---|---|---|---|
| Democratic | Roy Barnes | 259,482 | 65.6 | |
| Democratic | Thurbert Baker | 85,571 | 21.6 | |
| Democratic | David Poythress | 21,780 | 5.5 | |
| Democratic | DuBose Porter | 17,767 | 4.5 | |
| Democratic | Carl Camon | 4,170 | 1.1 | |
| Democratic | Bill Bolton | 3,573 | 0.9 | |
| Democratic | Randal Mangham | 3,124 | 0.8 | |
| Total votes | 395,497 | 100.0 | ||
Third party and independent candidates
[edit]Independent
[edit]- Neal Horsley[33]
Libertarian Party
[edit]- John Monds, president of the Grady County NAACP[34]
Write-in
[edit]- Samuel M. "Sam" Hay, III[33]
- Jacob Perasso (Socialist Workers Party)[33]
General election
[edit]Predictions
[edit]| Source | Ranking | As of |
|---|---|---|
| Cook Political Report[35] | Tossup | October 14, 2010 |
| Rothenberg[36] | Lean R | October 28, 2010 |
| RealClearPolitics[37] | Lean R | November 1, 2010 |
| Sabato's Crystal Ball[38] | Lean R | October 28, 2010 |
| CQ Politics[39] | Lean R | October 28, 2010 |
Polling
[edit]| Poll source | Dates administered | Nathan Deal (R) |
Roy Barnes (D) |
John Monds (L) |
Other | Undecided |
|---|---|---|---|---|---|---|
| Rasmussen Reports[40] | October 24, 2010 | 49% | 39% | 5% | 5% | 1% |
| Insider Advantage[41] | Unavailable | 49% | 41% | 3% | -- | 7% |
| Rasmussen Reports[40] | October 6, 2010 | 50% | 41% | 3% | 3% | 3% |
| Insider Advantage[42] | September 27, 2010 | 45% | 37% | 5% | -- | 13% |
| Rasmussen Reports[43] | September 21, 2010 | 45% | 39% | 5% | 6% | 5% |
| Insider Advantage[44] | September 16, 2010 | 42% | 42% | 5% | -- | 11% |
| Survey USA[45] | September 10–12, 2010 | 49% | 38% | 9% | -- | 4% |
| Insider Advantage[46] | August 17, 2010 | 45% | 41% | 5% | -- | 9% |
| Rasmussen Reports[47] | August 11, 2010 | 51% | 42% | -- | 3% | 3% |
| Rasmussen Reports[48] | July 21, 2010 | 49% | 43% | -- | 4% | 4% |
| Rasmussen Reports[49] | May 20, 2010 | 47% | 40% | -- | 6% | 7% |
| Rasmussen Reports[49] | April 22, 2010 | 46% | 39% | -- | 7% | 8% |
| Rasmussen Reports[49] | March 17, 2010 | 43% | 41% | -- | 5% | 13% |
| Public Policy Polling[50] | February 26–28, 2010 | 38% | 43% | -- | -- | 19% |
| Rasmussen Reports[49] | February 18, 2010 | 43% | 37% | -- | -- | -- |
| Rasmussen Reports[49] | January 20, 2010 | 42% | 43% | -- | -- | -- |
Results
[edit]| Party | Candidate | Votes | % | ±% | |
|---|---|---|---|---|---|
| Republican | Nathan Deal | 1,365,832 | 53.02% | −4.93% | |
| Democratic | Roy Barnes | 1,107,011 | 42.97% | +4.75% | |
| Libertarian | John Monds | 103,194 | 4.01% | +0.17% | |
| Write-in | 124 | 0.00% | N/A | ||
| Total votes | 2,576,161 | 100.00% | N/A | ||
| Republican hold | |||||
Counties that flipped from Republican to Democratic
[edit]- Early (largest city: Blakely)
- McIntosh (largest municipality: Darien)
- Peach (largest municipality: Fort Valley)
- Lowndes (largest city: Valdosta)
- Burke (largest municipality: Waynesboro)
- Chatham (largest city: Savannah)
- Washington (largest municipality: Sandersville)
- Sumter (largest city: Americus)
- Jefferson (largest city: Louisville)
- Muscogee (largest city: Columbus)
- Rockdale (largest town: Conyers)
See also
[edit]References
[edit]- ^ "Deal defeats Barnes to take Governor's Mansion". The Atlanta Journal-Constitution. Retrieved September 3, 2010.
- ^ [1][dead link]
- ^ Amy, Jeff (December 19, 2021). "Johnny Isakson, former Georgia Republican U.S. senator, dies". Associated Press.
- ^ Magellan Strategies
- ^ InsiderAdvantage
- ^ Rasmussen Reports
- ^ a b Mason-Dixon
- ^ Magellan Strategies
- ^ a b Survey USA
- ^ InsiderAdvantage
- ^ a b Survey USA
- ^ InsiderAdvantage
- ^ Rasmussen Reports
- ^ Rasmussen Reports
- ^ Rasmussen Reports
- ^ Rasmussen Reports
- ^ a b Strategic Vision
- ^ Landmark Communications
- ^ Georgia Newspapers
- ^ Insider Advantage
- ^ Landmark Communications
- ^ McLaughlin & Associates Archived July 14, 2011, at the Wayback Machine
- ^ "Unofficial And Incomplete Results of the Tuesday, July 20, 2010 General Primary Election", Georgia Secretary of State, July 20, 2010, archived from the original on July 23, 2010, retrieved July 25, 2010
- ^ "The 2010 Results Maps". Politico.Com. Retrieved August 21, 2010.
- ^ Jim Galloway (June 3, 2009). "Roy Barnes to join 2010 race for Georgia governor | Political Insider". Blogs.ajc.com. Archived from the original on June 10, 2010. Retrieved August 21, 2010.
- ^ Rasmussen Reports
- ^ InsiderAdvantage
- ^ Rasmussen Reports
- ^ Rasmussen Reports
- ^ Rasmussen Reports
- ^ Rasmussen Reports
- ^ "7/20/2010 - Governor". Sos.georgia.gov. Archived from the original on July 23, 2010. Retrieved August 21, 2010.
- ^ a b c "Georgia 2010 Midterm Election". Thegreenpapers.com. Retrieved August 21, 2010.
- ^ "John Monds to seek Libertarian nomination for Governor" www.lp.org. Retrieved September 15, 2009.
- ^ "2010 Governors Race Ratings". Cook Political Report. Archived from the original on October 28, 2010. Retrieved October 28, 2010.
- ^ "Governor Ratings". Rothenberg Political Report. Retrieved October 28, 2010.
- ^ "2010 Governor Races". RealClearPolitics. Retrieved October 28, 2010.
- ^ "THE CRYSTAL BALL'S FINAL CALLS". Sabato's Crystal Ball. October 28, 2010. Retrieved October 28, 2010.
- ^ "Race Ratings Chart: Governor". CQ Politics. Archived from the original on October 5, 2010. Retrieved October 28, 2010.
- ^ a b Rasmussen Reports
- ^ Insider Advantage
- ^ Insider Advantage
- ^ Rasmussen Reports
- ^ Insider Advantage
- ^ Survey USA
- ^ Insider Advantage
- ^ Rasmussen Reports
- ^ Rasmussen Reports
- ^ a b c d e Rasmussen Reports
- ^ Public Policy Polling
- ^ "11/2/2010 - Federal and Statewide". Archived from the original on March 27, 2016. Retrieved March 31, 2011.
External links
[edit]- Georgia Secretary of State – Elections Division Archived November 2, 2010, at the Wayback Machine
- Georgia Governor Candidates at Project Vote Smart
- Campaign contributions for 2010 Georgia Governor from Follow the Money
- Georgia Governor 2010 from OurCampaigns.com
- 2010 Georgia Gubernatorial General Election: Nathan Deal (R) vs Roy Barnes (D) graph of multiple polls from Pollster.com
- Election 2010: Georgia Governor from Rasmussen Reports
- 2010 Georgia Governor Race from Real Clear Politics
- 2010 Georgia Governor's Race from CQ Politics
- Race Profile in The New York Times
Debates
- Georgia Governor Republican Primary Runoff Debate, C-SPAN, August 8, 2010
Official campaign sites (archived)
 KSF
KSF


