2014 Chorley Borough Council election
 From Wikipedia - Reading time: 7 min
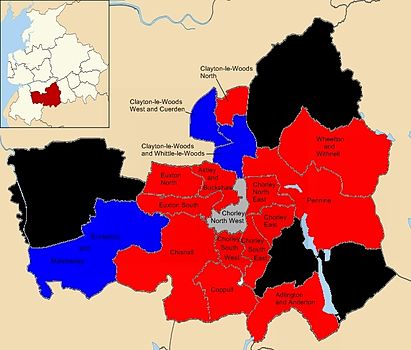
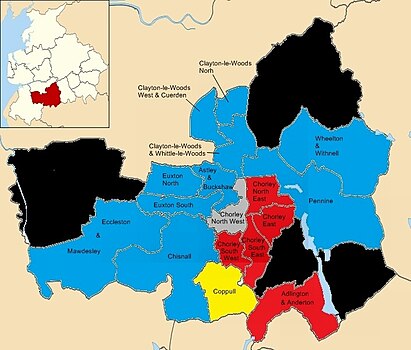
The 2014 Chorley Borough Council election took place on 22 May 2014 to elect members of Chorley Borough Council in England.[1] This was on the same day as other local elections. One third of the council was up for election and the Labour party held control.
Council make-up
[edit]After the election, the composition of the council was:
| Party | Seats | Current Council (2014) | ||||||||||||||||||||||||||||||||||||||||||||||||||
|---|---|---|---|---|---|---|---|---|---|---|---|---|---|---|---|---|---|---|---|---|---|---|---|---|---|---|---|---|---|---|---|---|---|---|---|---|---|---|---|---|---|---|---|---|---|---|---|---|---|---|---|---|
| 2010 | 2011 | 2012 | 2014 | |||||||||||||||||||||||||||||||||||||||||||||||||
| Labour | 15 | 20 | 24 | 32 | ||||||||||||||||||||||||||||||||||||||||||||||||
| Conservative | 27 | 23 | 20 | 13 | ||||||||||||||||||||||||||||||||||||||||||||||||
| Independent | 2 | 2 | 2 | 2 | ||||||||||||||||||||||||||||||||||||||||||||||||
| Lib Dems | 3 | 2 | 1 | 0 | ||||||||||||||||||||||||||||||||||||||||||||||||
Election result
[edit]| Party | Seats | Gains | Losses | Net gain/loss | Seats % | Votes % | Votes | +/− | |
|---|---|---|---|---|---|---|---|---|---|
| Labour | 13 | 8 | 0 | 76.5 | 46.2 | 13,908 | +7.2 | ||
| Conservative | 3 | 0 | 7 | 17.6 | 32.2 | 9,706 | −6.8 | ||
| Independent | 1 | 0 | 0 | 5.9 | 7.8 | 2,354 | −0.2 | ||
| UKIP | 0 | 0 | 0 | 0 | 11.5 | 3,547 | +10.5 | ||
| Liberal Democrats | 0 | 0 | 1 | 0 | 1.4 | 424 | −10.6 | ||
| Green | 0 | 0 | 0 | 0 | 0.5 | 160 | +0.0 | ||
Results map
[edit] |
 |
Wards
[edit]| Party | Candidate | Votes | % | ±% | |
|---|---|---|---|---|---|
| Labour | Graham Dunn | 1,126 | 48.3 | −9.7 | |
| Conservative | Charlotte Woods | 607 | 26.1 | −3.9 | |
| UKIP | Hayden Clewlow | 520 | 22.3 | N/A | |
| Liberal Democrats | Philip William Pilling | 76 | 3.3 | −9.7 | |
| Majority | 519 | 22.3 | |||
| Turnout | 2,329 | 40.8 | |||
| Labour hold | Swing | ||||
| Party | Candidate | Votes | % | ±% | |
|---|---|---|---|---|---|
| Labour | Matthew John Lynch | 788 | 47.1 | +1.1 | |
| Conservative | Alan Platt | 621 | 37.1 | −16.9 | |
| UKIP | Jeffrey Flinders Mallinson | 265 | 15.8 | N/A | |
| Majority | 167 | 10.0 | |||
| Turnout | 1,674 | 43.0 | |||
| Labour gain from Conservative | Swing | +9.0 | |||
Chisnall ward
[edit]| Party | Candidate | Votes | % | ±% | |
|---|---|---|---|---|---|
| Labour | Alan Whittaker | 848 | 57.1 | +24.1 | |
| Conservative | Harold Heaton | 637 | 42.9 | −8.1 | |
| Majority | 211 | 14.2 | |||
| Turnout | 1,485 | 45.7 | |||
| Labour gain from Conservative | Swing | ||||
| Party | Candidate | Votes | % | ±% | |
|---|---|---|---|---|---|
| Labour | Hasina Khan | 1,008 | 56.9 | −1.1 | |
| UKIP | Christopher Suart | 435 | 24.6 | N/A | |
| Conservative | Alan Cullens | 223 | 12.6 | −11.4 | |
| Independent | Melville George Coombes | 97 | 5.5 | −14.5 | |
| Green | Anne Calderbank | 18 | 1.0 | N/A | |
| Majority | 573 | 32.4 | |||
| Turnout | 1,771 | 36.0 | |||
| Labour hold | Swing | ||||
| Party | Candidate | Votes | % | ±% | |
|---|---|---|---|---|---|
| Labour | Alistair William Morwood | 1,162 | 69.1 | −2 | |
| Conservative | Matt Hansford | 519 | 30.9 | −15 | |
| Majority | 643 | 38.2 | |||
| Turnout | 1,681 | 35.0 | |||
| Labour hold | Swing | +7 | |||
| Party | Candidate | Votes | % | ±% | |
|---|---|---|---|---|---|
| Independent | Ralph Snape | 1,787 | 72.5 | −10.5 | |
| Labour | Aaron Beaver | 400 | 16.2 | N/A | |
| Conservative | Peter Malpas | 276 | 11.2 | −0.9 | |
| Majority | 1,387 | 52 | |||
| Turnout | 2,463 | 52.2 | |||
| Independent hold | Swing | ||||
| Party | Candidate | Votes | % | ±% | |
|---|---|---|---|---|---|
| Labour | Mrs. Beverley Murray | 968 | 49.0 | +3.6 | |
| Conservative | Mrs. Sarah Louise Kiley | 504 | 25.5 | −9.1 | |
| UKIP | David John McManus | 392 | 19.8 | N/A | |
| Green | Alistair James Straw | 66 | 3.3 | −1.0 | |
| Liberal Democrats | David Porter | 47 | 2.4 | −13.3 | |
| Majority | 464 | 23.5 | |||
| Turnout | 1,977 | 36.2 | |||
| Labour hold | Swing | ||||
| Party | Candidate | Votes | % | ±% | |
|---|---|---|---|---|---|
| Labour | Roy Lees | 1,184 | 67.3 | +20.3 | |
| Conservative | Dominic Keiran Jewell | 575 | 32.7 | −0.3 | |
| Majority | 609 | 34.6 | |||
| Turnout | 1,759 | 30.7 | |||
| Labour hold | Swing | +10.6 | |||
Clayton le Woods and Whittle le Woods ward
[edit]| Party | Candidate | Votes | % | ±% | |
|---|---|---|---|---|---|
| Conservative | Eric Bell | 1,409 | 58.6 | +3.6 | |
| Labour | Dan Croft | 703 | 41.4 | +17.4 | |
| Liberal Democrats | Glenda Charlesworth | 205 | 2.4 | −18.6 | |
| Majority | 706 | 17.3 | |||
| Turnout | 2,317 | 36.0 | |||
| Conservative hold | Swing | ||||
Clayton le Woods North ward
[edit]| Party | Candidate | Votes | % | ±% | |
|---|---|---|---|---|---|
| Labour | Charlie Bromilow | 732 | 58.4 | +24.4 | |
| Conservative | Chris Morris | 480 | 41.6 | +3.6 | |
| UKIP | Raymond McGrady | 458 | 19.8 | N/A | |
| Liberal Democrats | Stephen John Fenn | 96 | 2.4 | −25.6 | |
| Green | Mark Lee | 76 | 9.3 | N/A | |
| Majority | 289 | 17 | +8 | ||
| Turnout | 1,711 | 34.5 | |||
| Labour gain from Conservative | Swing | +4 | |||
Clayton le Woods West and Cuerden ward
[edit]| Party | Candidate | Votes | % | ±% | |
|---|---|---|---|---|---|
| Conservative | Mick Muncaster | 736 | 51.2 | −3.8 | |
| Labour | Paul Clark | 701 | 48.8 | +3.8 | |
| Majority | 35 | 2.4 | |||
| Turnout | 1,437 | 43.0 | |||
| Conservative hold | Swing | −3.8 | |||
| Party | Candidate | Votes | % | ±% | |
|---|---|---|---|---|---|
| Labour | Richard Toon | 885 | 57.3 | +24.1 | |
| Independent | Kenneth William Ball | 470 | 16.5 | N/A | |
| UKIP | Mark Smith | 383 | 19.8 | N/A | |
| Conservative | Tom Norris | 181 | 11.3 | −5.7 | |
| Majority | 462 | 26.1 | |||
| Turnout | 1,919 | 39.0 | |||
| Labour gain from Liberal Democrats | Swing | ||||
| Party | Candidate | Votes | % | ±% | |
|---|---|---|---|---|---|
| Conservative | Keith Iddon | 944 | 46.6 | −11.4 | |
| Labour | Stan Ely | 741 | 42.2 | +0.2 | |
| UKIP | Richard George Croll | 402 | 11.1 | N/A | |
| Majority | 203 | 4.4 | −10 | ||
| Turnout | 2,164 | 43.0 | |||
| Conservative hold | Swing | −5.8 | |||
| Party | Candidate | Votes | % | ±% | |
|---|---|---|---|---|---|
| Labour | Mike Handley | 692 | 53.8 | +6.7 | |
| Conservative | Robert Aron Wilding | 570 | 34.9 | −12.1 | |
| UKIP | Stuart Rickaby | 289 | 11.4 | N/A | |
| Majority | 122 | 18.9 | |||
| Turnout | 1,551 | 44.3 | |||
| Labour gain from Conservative | Swing | +9.4 | |||
| Party | Candidate | Votes | % | ±% | |
|---|---|---|---|---|---|
| Labour | Mark Andrew Jarnell | 572 | 40.2 | +13.8 | |
| Conservative | Debra Platt | 569 | 40.0 | −25.1 | |
| UKIP | David Smithies | 283 | 19.9 | N/A | |
| Majority | 3 | 0.2 | |||
| Turnout | 1,424 | 44.7 | |||
| Labour gain from Conservative | Swing | +19.5 | |||
Pennine
[edit]| Party | Candidate | Votes | % | ±% | |
|---|---|---|---|---|---|
| Labour | Gordon France | 354 | 44.3 | +6.3 | |
| Conservative | Marie Elizabeth Gray | 325 | 40.7 | −21.3 | |
| UKIP | Tom Shorrock | 120 | 15.0 | N/A | |
| Majority | 29 | 3.6 | |||
| Turnout | 799 | 46.0 | |||
| Labour gain from Conservative | Swing | ||||
| Party | Candidate | Votes | % | ±% | |
|---|---|---|---|---|---|
| Labour | Margaret Mary France | 1,044 | 66.3 | +19.1 | |
| Conservative | Alison Marie Hansford | 530 | 33.7 | −19.1 | |
| Majority | 514 | 32.7 | |||
| Turnout | 1,574 | 49.4 | |||
| Labour gain from Conservative | Swing | +19.1 | |||
References
[edit]- ^ "England council results". BBC News. Retrieved 23 May 2014.
Licensed under CC BY-SA 3.0 | Source: https://en.wikipedia.org/wiki/2014_Chorley_Borough_Council_election4 views | ↧ Download as ZWI file
 KSF
KSF