2014 Northern Cape provincial election
 From Wikipedia - Reading time: 5 min
| |||||||||||||||||||||||||||||||||||||||||||||||||||||||||||||||||
All 30 seats to the Northern Cape Provincial Legislature 16 seats needed for a majority | |||||||||||||||||||||||||||||||||||||||||||||||||||||||||||||||||
|---|---|---|---|---|---|---|---|---|---|---|---|---|---|---|---|---|---|---|---|---|---|---|---|---|---|---|---|---|---|---|---|---|---|---|---|---|---|---|---|---|---|---|---|---|---|---|---|---|---|---|---|---|---|---|---|---|---|---|---|---|---|---|---|---|---|
| Turnout | 71.30% | ||||||||||||||||||||||||||||||||||||||||||||||||||||||||||||||||
| |||||||||||||||||||||||||||||||||||||||||||||||||||||||||||||||||
 | |||||||||||||||||||||||||||||||||||||||||||||||||||||||||||||||||
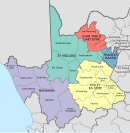
The 2014 Northern Cape provincial election was held on 7 May 2014 to elect all 30 members of the Northern Cape Provincial Legislature. As with all South African provincial elections, it was held concurrent with the 2014 South African general election. The ruling ANC gained a seat, and the opposition Democratic Alliance gained three seats.[1][2] The Economic Freedom Fighters, founded less than a year earlier, won two seats.[1][3]
Results
[edit] | |||||
|---|---|---|---|---|---|
| Party | Votes | % | Seats | +/– | |
| African National Congress | 272,053 | 64.40 | 20 | +1 | |
| Democratic Alliance | 100,916 | 23.89 | 7 | +1 | |
| Economic Freedom Fighters | 20,951 | 4.96 | 2 | New | |
| Congress of the People | 15,218 | 3.60 | 1 | –4 | |
| Freedom Front Plus | 4,600 | 1.09 | 0 | 0 | |
| African Christian Democratic Party | 2,421 | 0.57 | 0 | 0 | |
| United Christian Democratic Party | 1,542 | 0.37 | 0 | 0 | |
| African People's Convention | 1,191 | 0.28 | 0 | 0 | |
| Azanian People's Organisation | 1,062 | 0.25 | 0 | 0 | |
| Patriotic Alliance | 584 | 0.14 | 0 | New | |
| Independent Civic Organisation | 499 | 0.12 | 0 | New | |
| Pan Africanist Congress | 460 | 0.11 | 0 | 0 | |
| United Democratic Movement | 366 | 0.09 | 0 | 0 | |
| Inkatha Freedom Party | 239 | 0.06 | 0 | 0 | |
| First Nation Liberation Alliance | 194 | 0.05 | 0 | New | |
| National Freedom Party | 139 | 0.03 | 0 | New | |
| Total | 422,435 | 100.00 | 30 | 0 | |
| Valid votes | 422,435 | 98.58 | |||
| Invalid/blank votes | 6,106 | 1.42 | |||
| Total votes | 428,541 | 100.00 | |||
| Registered voters/turnout | 601,080 | 71.30 | |||
| Source: Election Resources | |||||
References
[edit]- ^ a b c "Electoral Commission : 2014 National and Provincial Elections: Northern Cape results". 20 January 2021. Archived from the original on 20 January 2021. Retrieved 12 December 2021.
- ^ a b "2009 Northern Cape Legislature election results". www.eisa.org. Retrieved 12 December 2021.
- ^ Saville, Meggan (12 July 2013). "Malema launches his Economic Freedom Fighters". DispatchLIVE. Retrieved 14 December 2021.
Further reading
[edit]- Engel, Ulf (1 August 2014). "South Africa: The 2014 National and Provincial Elections". Africa Spectrum. 49 (2): 79–89. doi:10.1177/000203971404900204. S2CID 142278190. Retrieved 12 December 2021.
Licensed under CC BY-SA 3.0 | Source: https://en.wikipedia.org/wiki/2014_Northern_Cape_provincial_election2 views | ↧ Download as ZWI file
 KSF
KSF

