2014 Western Cape provincial election
 From Wikipedia - Reading time: 5 min
| |||||||||||||||||||||||||||||||||||||||||||||
All 42 seats to the Western Cape Provincial Parliament 22 seats needed for a majority | |||||||||||||||||||||||||||||||||||||||||||||
|---|---|---|---|---|---|---|---|---|---|---|---|---|---|---|---|---|---|---|---|---|---|---|---|---|---|---|---|---|---|---|---|---|---|---|---|---|---|---|---|---|---|---|---|---|---|
| Turnout | 72.76% | ||||||||||||||||||||||||||||||||||||||||||||
| |||||||||||||||||||||||||||||||||||||||||||||
 Map showing the winning party by ward. | |||||||||||||||||||||||||||||||||||||||||||||
| |||||||||||||||||||||||||||||||||||||||||||||
| This article is part of a series on the |
| Politics of the Western Cape |
|---|
A provincial election was held in the Western Cape on 7 May 2014 to elect a new provincial parliament. It was the fifth provincial election held since the end of the apartheid era, and also the first held since the death of Nelson Mandela. Although not constitutionally required, the election was held simultaneously with elections to the National Assembly. The legislature is unicameral, and consists of 42 members elected by a system of party-list proportional representation.
The Western Cape calls its legislature the "Provincial Parliament" and the members "Members of Provincial Parliament (MPPs)". The other provinces use the terms "Provincial Legislature" and "Members of the Provincial Legislature".
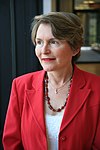
The Premier of the Western Cape is chosen by the Provincial Parliament. The incumbent Premier Helen Zille was re-elected.[4]
Results
[edit]The Western Cape was the only province not won by the ANC, the DA increased its majority from 51.46% to 59.38%. The African National Congress came in second with 32.89% of the vote, while the newly formed Economic Freedom Fighters obtained 2.1%. The African Christian Democratic Party gained 1.02% of the vote.[5]
 | |||||
|---|---|---|---|---|---|
| Party | Votes | % | Seats | +/– | |
| Democratic Alliance | 1,259,645 | 59.38 | 26 | +2 | |
| African National Congress | 697,664 | 32.89 | 14 | 0 | |
| Economic Freedom Fighters | 44,762 | 2.11 | 1 | New | |
| African Christian Democratic Party | 21,696 | 1.02 | 1 | 0 | |
| Al Jama-ah | 13,182 | 0.62 | 0 | 0 | |
| Congress of the People | 12,520 | 0.59 | 0 | –3 | |
| Independent Civic Organisation | 11,949 | 0.56 | 0 | New | |
| Freedom Front Plus | 11,587 | 0.55 | 0 | 0 | |
| United Democratic Movement | 10,199 | 0.48 | 0 | 0 | |
| Patriotic Alliance | 8,510 | 0.40 | 0 | New | |
| African Independent Congress | 6,508 | 0.31 | 0 | New | |
| Agang South Africa | 6,398 | 0.30 | 0 | New | |
| Pan Africanist Congress | 3,591 | 0.17 | 0 | 0 | |
| National Party | 2,694 | 0.13 | 0 | 0 | |
| African People's Convention | 1,291 | 0.06 | 0 | 0 | |
| African National Party | 1,249 | 0.06 | 0 | New | |
| Indigenous Peoples Organisation | 1,180 | 0.06 | 0 | New | |
| United Christian Democratic Party | 1,158 | 0.05 | 0 | 0 | |
| Inkatha Freedom Party | 1,078 | 0.05 | 0 | 0 | |
| Azanian People's Organisation | 844 | 0.04 | 0 | 0 | |
| National Freedom Party | 763 | 0.04 | 0 | New | |
| South African Progressive Civic Organisation | 642 | 0.03 | 0 | New | |
| First Nation Liberation Alliance | 635 | 0.03 | 0 | New | |
| Kingdom Governance Movement | 490 | 0.02 | 0 | New | |
| Sibanye Civic Association | 478 | 0.02 | 0 | New | |
| Peoples Alliance | 440 | 0.02 | 0 | New | |
| Total | 2,121,153 | 100.00 | 42 | 0 | |
| Valid votes | 2,121,153 | 99.12 | |||
| Invalid/blank votes | 18,937 | 0.88 | |||
| Total votes | 2,140,090 | 100.00 | |||
| Registered voters/turnout | 2,941,333 | 72.76 | |||
| Source: Election Resources | |||||
References
[edit]- ^ Eyewitness News. "DA announces premier candidates" Eyewitness News, Johannesburg, 2014. Retrieved on 15 June 2018.
- ^ SAPA. "ANC submits provincial candidate lists to IEC" Polity, 12 March 2014. Retrieved on 15 June 2018.
- ^ Felix, Jason. "EFF names W Cape Candidates" IOL, Cape Town, 25 March 2014. Retrieved on 15 June 2018.
- ^ Eyewitness News. "DA celbrates Western Cape win", Eyewitness News, 9 May 2014. Retrieved on 15 June 2018.
- ^ Sapa. "It's official: 2014 election results announced", Mail & Guardian, 10 May 2014. Retrieved on 15 June 2018.
 KSF
KSF
