2016 Tennessee Republican presidential primary
 From Wikipedia - Reading time: 8 min
| |||||||||||||||||||||||||||||||||||||||||||||||
58 Republican National Convention delegates | |||||||||||||||||||||||||||||||||||||||||||||||
|---|---|---|---|---|---|---|---|---|---|---|---|---|---|---|---|---|---|---|---|---|---|---|---|---|---|---|---|---|---|---|---|---|---|---|---|---|---|---|---|---|---|---|---|---|---|---|---|
| |||||||||||||||||||||||||||||||||||||||||||||||
| |||||||||||||||||||||||||||||||||||||||||||||||
| Elections in Tennessee |
|---|
 |
|
|
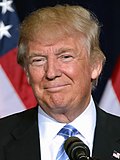
The 2016 Tennessee Republican presidential primary took place on Super Tuesday, March 1, 2016, in the U.S. state of Tennessee as one of the Republican Party's primaries ahead of the 2016 presidential election. Businessman Donald Trump won the primary with a plurality, carrying 38.94% of the vote and all but one county, awarding him 33 delegates.[1]
Texas Senator Ted Cruz, came second with 24.71% of the vote and 16 delegates. Florida Senator Marco Rubio came third with 21.18% of the vote and 9 delegates, carrying only the county of Williamson. All other candidates did not receive any delegates.[2]
The Democratic Party held their own Tennessee primary on the same day, which was won by Hillary Clinton.
Opinion polling
[edit]Primary date: March 1, 2016
| Poll source | Date | 1st | 2nd | 3rd | Other |
|---|---|---|---|---|---|
| Primary results[3] | March 1, 2016 | Donald Trump 38.94% |
Ted Cruz 24.71% |
Marco Rubio 21.18% |
Ben Carson 7.59%, John Kasich 5.29%, Jeb Bush 1.12%, Mike Huckabee 0.28%, Rand Paul 0.27%, Chris Christie 0.15%, Carly Fiorina 0.08%, Rick Santorum 0.08%, Jim Gilmore 0.03%, Lindsey Graham 0.03%, George Pataki 0.02% |
| SurveyMonkey
Margin of error: ± ?% Sample size: 772 |
February 22–29, 2016 | Donald Trump 48% |
Marco Rubio 18% |
Ted Cruz 15% |
Ben Carson 10%, John Kasich 5%, Undecided 4% |
| NBC News/Wall Street Journal/Marist[4] Margin of error: ± 3.8%
|
February 22–25, 2016 | Donald Trump 40% |
Ted Cruz 22% |
Marco Rubio 19% |
Ben Carson 9%, John Kasich 6% |
| Vanderbilt/PSRA[5]
Margin of error: 5.6%
|
November 11–23, 2015 | Donald Trump 29% |
Ben Carson 25% |
Ted Cruz 14% |
Marco Rubio 12%, Jeb Bush 6%, Carly Fiorina 2%, Undecided 7%, Other 4%, Wouldn't Vote 1% |
| Opinion Savvy/Insider Advantage[6]
Margin of error: 4.6%
|
August 2–3, 2015 | Donald Trump 35.3% |
Ben Carson 14.5% |
Jeb Bush 11.7% |
Mike Huckabee 6.5%, Ted Cruz 6.2%, Scott Walker 5.8%, John Kasich 3.3%, Rand Paul 3%, Marco Rubio 2.8%, Chris Christie 1.7%, Carly Fiorina 1.7%, Bobby Jindal 1.4%, Rick Santorum 0.7%, George Pataki 0.3%, Lindsey Graham 0.2%, Rick Perry 0.2%, Someone else 1.3%, Undecided 3.5% |
Results
[edit]| Candidate | Votes | Percentage | Actual delegate count | ||
|---|---|---|---|---|---|
| Bound | Unbound | Total | |||
| Donald Trump | 333,180 | 38.94% | 33 | 0 | 33 |
| Ted Cruz | 211,471 | 24.71% | 16 | 0 | 16 |
| Marco Rubio | 181,274 | 21.18% | 9 | 0 | 9 |
| Ben Carson | 64,951 | 7.59% | 0 | 0 | 0 |
| John Kasich | 45,301 | 5.29% | 0 | 0 | 0 |
| Jeb Bush (withdrawn) | 9,551 | 1.12% | 0 | 0 | 0 |
| Mike Huckabee (withdrawn) | 2,415 | 0.28% | 0 | 0 | 0 |
| Rand Paul (withdrawn) | 2,350 | 0.27% | 0 | 0 | 0 |
| Uncommitted | 1,849 | 0.22% | 0 | 0 | 0 |
| Chris Christie (withdrawn) | 1,256 | 0.15% | 0 | 0 | 0 |
| Carly Fiorina (withdrawn) | 715 | 0.08% | 0 | 0 | 0 |
| Rick Santorum (withdrawn) | 710 | 0.08% | 0 | 0 | 0 |
| Jim Gilmore (withdrawn) | 267 | 0.03% | 0 | 0 | 0 |
| Lindsey Graham (withdrawn) | 253 | 0.03% | 0 | 0 | 0 |
| George Pataki (withdrawn) | 186 | 0.02% | 0 | 0 | 0 |
| Unprojected delegates: | 0 | 0 | 0 | ||
| Total: | 855,729 | 100.00% | 58 | 0 | 58 |
| Source: The Green Papers | |||||
See also
[edit]- 2016 Tennessee Democratic presidential primary
- 2016 United States presidential election in Tennessee
- 2016 Tennessee elections
References
[edit]- ^ "Tennessee Primary Election Results 2016". The New York Times. September 29, 2016. ISSN 0362-4331. Retrieved February 12, 2024.
- ^ "Tennessee Primary Election Results 2016: President Live Map by County, Real-Time Voting Updates". Election Hub. Retrieved February 12, 2024.
- ^ Primary results
- ^ "Polls: Trump, Clinton Ahead in Super Tuesday States". NBC News/Wall Street Journal/Marist. February 29, 2016. Retrieved February 29, 2016.
- ^ Vanderbilt/PSRA
- ^ Opinion Savvy/Insider Advantage
 KSF
KSF


