Categories
Babergh District Council elections
 From Wikipedia - Reading time: 5 min
Babergh District Council in Suffolk, England is elected every four years. Since the last boundary changes in 2019, 32 councillors have been elected from 24 wards.[1]
Council elections
[edit]- 1973 Babergh District Council election
- 1976 Babergh District Council election
- 1979 Babergh District Council election (New ward boundaries)[2]
- 1983 Babergh District Council election
- 1987 Babergh District Council election
- 1991 Babergh District Council election (District boundary changes took place but the number of seats remained the same)[3]
- 1995 Babergh District Council election
- 1999 Babergh District Council election
- 2003 Babergh District Council election (New ward boundaries)[4][5][6]
- 2007 Babergh District Council election
- 2011 Babergh District Council election
- 2015 Babergh District Council election
- 2019 Babergh District Council election (New ward boundaries)[1]
- 2023 Babergh District Council election
District result maps
[edit]-
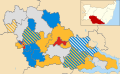 2003 results map
 -
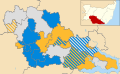 2007 results map
 -
 2011 results map
 -
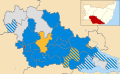 2015 results map
 -
 2019 results map
 -
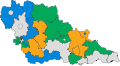 2023 results map


By-election results
[edit]1993-1997
[edit]| Party | Candidate | Votes | % | ±% | |
|---|---|---|---|---|---|
| Liberal Democrats | 506 | 60.7 | |||
| Conservative | 276 | 33.1 | |||
| Labour | 51 | 6.1 | |||
| Majority | 230 | 27.6 | |||
| Turnout | 833 | 48.0 | |||
| Liberal Democrats gain from Independent | Swing | ||||
1997-2001
[edit]| Party | Candidate | Votes | % | ±% | |
|---|---|---|---|---|---|
| Liberal Democrats | 327 | 63.4 | |||
| Conservative | 189 | 36.6 | |||
| Majority | 138 | 26.8 | |||
| Turnout | 516 | 50.0 | |||
| Liberal Democrats gain from Independent | Swing | ||||
| Party | Candidate | Votes | % | ±% | |
|---|---|---|---|---|---|
| Labour | Neil Macmaster | 309 | 56.4 | −3.6 | |
| UKIP | Derek Allen | 239 | 43.6 | +43.6 | |
| Majority | 70 | 12.8 | |||
| Turnout | 548 | 19.5 | |||
| Labour hold | Swing | ||||
2007-2011
[edit]| Party | Candidate | Votes | % | ±% | |
|---|---|---|---|---|---|
| Liberal Democrats | Richard Whiting | 446 | 49.0 | +25.5 | |
| Conservative | Peter Burgoyne | 261 | 28.6 | +3.6 | |
| Independent | Jan Byrne | 138 | 15.1 | −6.4 | |
| UKIP | Reginald Smith | 66 | 7.2 | −3.7 | |
| Majority | 185 | 20.4 | |||
| Turnout | 911 | 27.4 | |||
| Liberal Democrats hold | Swing | ||||
| Party | Candidate | Votes | % | ±% | |
|---|---|---|---|---|---|
| Labour | Anthony Bavington | 340 | 45.1 | +2.7 | |
| Conservative | Martin Fryer | 201 | 26.7 | −30.9 | |
| Liberal Democrats | Richard Platt | 141 | 18.7 | +18.7 | |
| UKIP | Leon Stedman | 72 | 9.5 | +9.5 | |
| Majority | 139 | 18.4 | |||
| Turnout | 754 | 22.8 | |||
| Labour gain from Conservative | Swing | ||||
2011-2015
[edit]| Party | Candidate | Votes | % | ±% | |
|---|---|---|---|---|---|
| Conservative | James Cartlidge | 305 | |||
| Green | Laura Smith | 136 | |||
| Labour | Hadley French Gerrard | 71 | |||
| Majority | 169 | ||||
| Turnout | 37.22 | ||||
| Conservative hold | Swing | ||||
| Party | Candidate | Votes | % | ±% | |
|---|---|---|---|---|---|
| Green | Robert Lindsay | 346 | |||
| Conservative | David Talbot Clarke | 330 | |||
| UKIP | Stephen Laing | 219 | |||
| Labour | Angela Wiltshire | 72 | |||
| Majority | 16 | ||||
| Turnout | |||||
| Green gain from Conservative | Swing | ||||
2015-2019
[edit]| Party | Candidate | Votes | % | ±% | |
|---|---|---|---|---|---|
| Labour | Luke Cresswell | 336 | 42.7 | +20.4 | |
| Conservative | Simon Sudbury | 335 | 42.6 | +11.0 | |
| Liberal Democrats | Andrew Welsh | 116 | 14.7 | +3.6 | |
| Majority | 1 | 0.1 | |||
| Turnout | 787 | ||||
| Labour gain from Conservative | Swing | ||||
2015-2019
[edit]| Party | Candidate | Votes | % | ±% | |
|---|---|---|---|---|---|
| Conservative | Simon Barrett | 971 | 46.4 | +9.0 | |
| Labour | Jake Thomas | 602 | 28.7 | −0.7 | |
| Liberal Democrats | Marjorie Bark | 287 | 13.7 | +0.2 | |
| Green | James Killbery | 234 | 11.2 | −8.6 | |
| Majority | 369 | 17.6 | |||
| Turnout | 2,094 | ||||
| Conservative hold | Swing | ||||
See also
[edit]References
[edit]- ^ a b "The Babergh (Electoral Changes) Order 2018", legislation.gov.uk, The National Archives, SI 2018/1315, retrieved 3 January 2024
- ^ The District of Babergh (Electoral Arrangements) Order 1976
- ^ legislation.gov.uk - The Essex and Suffolk (County Boundaries) Order 1989. Retrieved on 5 November 2015.
- ^ "Local elections". * BBC News Online. Retrieved 9 June 2011.
- ^ legislation.gov.uk - The District of Babergh (Electoral Changes) Order 2001. Retrieved on 4 October 2015.
- ^ legislation.gov.uk - The District of Babergh (Electoral Changes) (Amendment) Order 2002. Retrieved on 4 October 2015.
- ^ "Past election results" (PDF). Babergh District Council. Archived from the original (PDF) on 22 July 2011. Retrieved 9 June 2011.
- ^ Dines, Graham (9 November 2007). "11.6% swing to Lib Dems in Hadleigh". Eastern Daily Press. Archived from the original on 13 August 2012. Retrieved 9 June 2011.
- ^ Land, Jon (30 July 2010). "Labour vote surges in latest council by-elections". 24dash.com. Archived from the original on 23 December 2010. Retrieved 9 June 2011.
- ^ "Declaration of result of poll" (PDF). Babergh District Council. Archived from the original (PDF) on 22 July 2011. Retrieved 9 June 2011.
- ^ "Local Elections Archive Project — Sudbury South Ward". www.andrewteale.me.uk. Retrieved 14 February 2024.
- ^ "Local Elections Archive Project — Great Cornard Ward". www.andrewteale.me.uk. Retrieved 14 February 2024.
- By-election results Archived 2010-03-29 at the Wayback Machine
External links
[edit]Licensed under CC BY-SA 3.0 | Source: https://en.wikipedia.org/wiki/Babergh_District_Council_elections45 views | Status: cached on March 09 2025 23:02:37↧ Download as ZWI file
 EncycloReader
is supported by the
EncycloReader
is supported by the