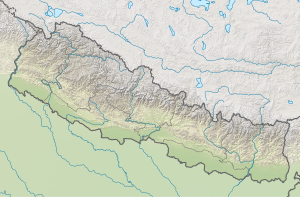
Bhojpur, Nepal
 From Wikipedia - Reading time: 6 min
Bhojpur
भोजपुर | |
|---|---|
| Coordinates: 27°10′N 87°3′E / 27.167°N 87.050°E | |
| Country | |
| Province | Province No. 1 |
| District | Bhojpur |
| Municipality | Bhojpur Municipality |
| Wards | 6, 7, 8 & 9 |
| Established | 10 March 2017 |
| Government | |
| • Type | Ward council |
| • Term of office | (2017 - 2022) |
| Area | |
• Total | 13.45 km2 (5.19 sq mi) |
| Population (2011) | |
• Total | 7,446 |
| • Density | 550/km2 (1,400/sq mi) |
| Time zone | UTC+5:45 (Nepal Standard Time) |
| Website | www |
Bhojpur is a neighborhood in Bhojpur Municipality which is located in Bhojpur District in Province No. 1 of Nepal. The Bhojpur Village Panchayat was established in 1962 and was renamed Bhojpur Village Development Committee in 1990.[1][2]
On 18 May 2014 the Government of Nepal declared 72 new municipalities within the country.[3] These included Bhojpur Municipality, incorporating Bhojpur, Bhaisipankha, Bokhim and Taksar VDCs. Current wards no. 6, 7, 8 and 9 of Bhojpur Municipality belong to the core Bhojpur area which is the main urbanized settlement of Bhojpur Municipality.
At the 1991 Nepal census Bhojpur VDC had a population of 7,446 individuals with 2,070 households.[4] Now the total population of the Bhojpur (2011 Nepal census) is 7,446 spread over 13.45 square kilometres (5.19 sq mi). The headquarter of the Bhojpur District and the Bhojpur Municipality is located at ward no. 7 of the Bhojpur Municipality.[5]
| Before 2017 | After 2017 |
|---|---|
 |
|
| Bhojpur & other VDCs | Bhojpur VDC divided into wards (6, 7, 8, 9) |
| Neighborhood | Ward no. | Area | Population (2011) | Ward chairperson |
|---|---|---|---|---|
| Bhojpur | 6 | 4.03 KM² | 1,710 | Shailendra Karki |
| 7 | 2.29 KM² | 2,805 | Jai Bahadur Taamang | |
| 8 | 4.75 KM² | 1,160 | Gopal Karki | |
| 9 | 2.38 KM² | 1,771 | Ram Bahadur Taamang |
Climate
[edit]| Climate data for Bhojpur, elevation 1,595 m (5,233 ft), (1976–2005) | |||||||||||||
|---|---|---|---|---|---|---|---|---|---|---|---|---|---|
| Month | Jan | Feb | Mar | Apr | May | Jun | Jul | Aug | Sep | Oct | Nov | Dec | Year |
| Mean daily maximum °C (°F) | 13.5 (56.3) |
15.4 (59.7) |
19.8 (67.6) |
22.9 (73.2) |
23.5 (74.3) |
24.1 (75.4) |
23.8 (74.8) |
24.1 (75.4) |
23.3 (73.9) |
21.6 (70.9) |
18.6 (65.5) |
15.1 (59.2) |
20.5 (68.9) |
| Mean daily minimum °C (°F) | 5.0 (41.0) |
6.6 (43.9) |
10.4 (50.7) |
13.7 (56.7) |
15.5 (59.9) |
17.5 (63.5) |
18.0 (64.4) |
17.8 (64.0) |
16.9 (62.4) |
13.8 (56.8) |
10.2 (50.4) |
6.4 (43.5) |
12.7 (54.8) |
| Average precipitation mm (inches) | 20.4 (0.80) |
12.3 (0.48) |
29.9 (1.18) |
70.1 (2.76) |
143.1 (5.63) |
215.5 (8.48) |
277.7 (10.93) |
218.3 (8.59) |
168.8 (6.65) |
79.3 (3.12) |
14.7 (0.58) |
9.3 (0.37) |
1,259.4 (49.57) |
| Source 1: Agricultural Extension in South Asia[6] | |||||||||||||
| Source 2: Japan International Cooperation Agency (precipitation)[7] | |||||||||||||
References
[edit]- ^ "The Constitution of Nepal, 1962" (PDF). constitutionnet.org. Retrieved 24 January 2021.
- ^ "स्थानीय निर्वाचनको इतिहास". research.butmedia.org. Archived from the original on 22 July 2018. Retrieved 24 January 2021.
- ^ "Government announces 72 new municipalities". The Kathmandu Post. Archived from the original on 2014-10-06. Retrieved 2014-06-10.
- ^ "National Population and Housing Census 2011 (Village Development Committee" (PDF). MOFALD. 2011. Retrieved 17 January 2021.
- ^ "स्थानीय तहहरुको विवरण" [Details of the local level bodies]. www.mofald.gov.np/en (in Nepali). Ministry of Federal Affairs and Local Development. Retrieved 17 July 2018.
- ^ "TEMPORAL AND SPATIAL VARIABILITY OF CLIMATE CHANGE OVER NEPAL (1976-2005)" (PDF). Agricultural Extension in South Asia. Archived from the original (PDF) on 13 October 2023. Retrieved 14 October 2023.
- ^ "ネパール国 全国貯水式水力発電所マスタープラン調査 ファイナルレポート" (PDF). Japan International Cooperation Agency. Archived from the original (PDF) on 6 April 2024. Retrieved 6 April 2024.
 KSF
KSF
