Citrus Park, Arizona
 From Wikipedia - Reading time: 7 min
Citrus Park, Arizona | |
|---|---|
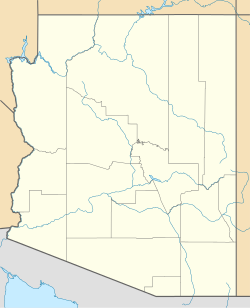
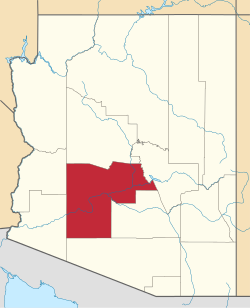
 Location in Maricopa County, Arizona | |
| Coordinates: 33°31′58″N 112°26′45″W / 33.53278°N 112.44583°W | |
| Country | United States |
| State | Arizona |
| County | Maricopa |
| Area | |
• Total | 4.955 sq mi (12.834 km2) |
| • Land | 4.953 sq mi (12.828 km2) |
| • Water | 0.002 sq mi (0.005 km2) |
| Elevation | 1,152 ft (351 m) |
| Population | |
• Total | 5,194 |
| • Density | 895.52/sq mi (345.81/km2) |
| Time zone | UTC-7 (MST (no DST)) |
| FIPS code | 04-13820 |
| GNIS feature ID | 2582757[2] |
Citrus Park is an unincorporated area and census-designated place (CDP) in Maricopa County, Arizona, United States. The population was 5,194 at the time of the 2020 census,[3] an increase of 28.9% over the population of 4,028 in 2010.[4]
Citrus Park is served by the Waddell, Arizona post office. Citrus Park neighborhoods are served by irrigation water.[5]
Geography
[edit]Citrus Park is on the western side of the Phoenix metropolitan area. It is bordered to the south by Goodyear and to the east by Glendale. Perryville Road, which forms the western boundary of Citrus Park, is technically within the Glendale city limits, indicating a potential westward extension of Glendale into Citrus Park in the future.[6] Northern Avenue is the northern boundary of Citrus Park. The community is 25 miles (40 km) west-northwest of downtown Phoenix.
Demographics
[edit]| Census | Pop. | Note | %± |
|---|---|---|---|
| 2010 | 4,028 | — | |
| 2020 | 5,194 | 28.9% | |
| Census Data Tables[3][4] | |||
2020 census data
[edit]| Race and ethnicity | Population | % of total population |
|---|---|---|
| American Indian and Alaska Native | 42 | 0.809% |
| Asian | 93 | 1.791% |
| Black or African American | 122 | 2.349% |
| Hispanic or Latino of any race | 1,006 | 19.369% |
| Native Hawaiian and Pacific Islander | 2 | 0.039% |
| Not Hispanic or Latino | 3,713 | 71.486% |
| Some other race | 330 | 6.353% |
| Two or more races | 611 | 11.764% |
| White | 3,994 | 76.896% |
American Community Survey data
[edit]Information from American Community Survey 2016-2020 five-year estimates:[7]
| Statistic | Value |
|---|---|
| Land area | 4.953 sq mi |
| Total population | 5,194 |
| Median household income | $108,750 |
| Bachelor's degree or higher | 28.0% |
| Employment rate | 56.6% |
| Total housing units | 1,680 |
| Without health care coverage | 6.5% |
| Total households | 1,615 |
| Age range | % of total population |
|---|---|
| Under 5 years | 3.9% |
| Under 18 years | 23.0% |
| 18 years and over | 77.0% |
| 65 years and over | 14.5% |
Notes
[edit]- ^ "2021 U.S. Gazetteer Files: Arizona". United States Census Bureau. Retrieved May 16, 2022.
- ^ a b U.S. Geological Survey Geographic Names Information System: Citrus Park, Arizona
- ^ a b c d "Citrus Park CDP, Arizona: 2020 DEC Redistricting Data (PL 94-171)". U.S. Census Bureau. Retrieved May 16, 2022.
- ^ a b "2010 Census Data Tables - Citrus Park CDP, Arizona". data.census.gov. Retrieved January 26, 2022.
- ^ https://azgeo-open-data-agic.hub.arcgis.com/datasets/azwater::irrigation-district-2024/explore?location=33.542620%2C-112.435457%2C15.00
- ^ "TIGERweb: Citrus Park CDP, Arizona". Geography Division, U.S. Census Bureau. Retrieved May 16, 2022.
- ^ "Data Profile - Citrus Park CDP, Arizona". data.census.gov. Retrieved January 26, 2022.
External links
[edit]- Clearwater Farms Unit 1 - irrigation
- Clearwater Farms Unit II POA - irrigation
- Clearwater Farms Unit Three Property Owners Association
 KSF
KSF

