Eelde
 From Wikipedia - Reading time: 5 min
Eelde | |
|---|---|
 Former townhall in 2010 | |
 | |
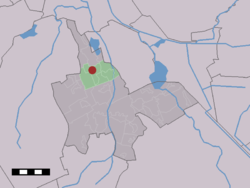
 The village (dark red) and the statistical district (light green) of Eelde in the municipality of Tynaarlo. | |
| Coordinates: 53°08′00″N 6°34′00″E / 53.13333°N 6.56667°E | |
| Country | Netherlands |
| Province | Drenthe |
| Municipality | Tynaarlo |
| Population | |
• Total | 7,000 |
| Eelde-Paterswolde ca. 11,000 | |
| Time zone | UTC+1 (CET) |
| • Summer (DST) | UTC+2 (CEST) |
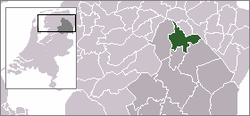
Eelde (Dutch pronunciation: [ˈeːldə]) is a town in the Dutch province of Drenthe. It is a part of the municipality of Tynaarlo, and lies about 9 km south of Groningen. Groningen Airport Eelde is located near the village.
Eelde was a separate municipality until 1998, when it was merged with Vries and Zuidlaren.[1]
During the 20th century, the villages of Eelde and Paterswolde have merged into one, "Eelde-Paterswolde". In 2012, Eelde counted 6,660 inhabitants, and Paterswolde 3,680, together 10,340 inhabitants.[2]
Its major attractions are Groningen Airport Eelde, museum "De Buitenplaats", the annual flower parade and the lake "Paterswoldse meer".
Climate
[edit]| Climate data for Eelde (1991−2020 normals, extremes 1906−present) | |||||||||||||
|---|---|---|---|---|---|---|---|---|---|---|---|---|---|
| Month | Jan | Feb | Mar | Apr | May | Jun | Jul | Aug | Sep | Oct | Nov | Dec | Year |
| Record high °C (°F) | 14.5 (58.1) |
18.9 (66.0) |
24.0 (75.2) |
28.8 (83.8) |
32.8 (91.0) |
33.8 (92.8) |
36.9 (98.4) |
36.3 (97.3) |
32.6 (90.7) |
27.4 (81.3) |
19.4 (66.9) |
15.4 (59.7) |
36.9 (98.4) |
| Mean daily maximum °C (°F) | 5.2 (41.4) |
6.0 (42.8) |
9.5 (49.1) |
14.2 (57.6) |
17.6 (63.7) |
20.4 (68.7) |
22.7 (72.9) |
22.6 (72.7) |
19.0 (66.2) |
14.2 (57.6) |
9.0 (48.2) |
5.9 (42.6) |
13.9 (57.0) |
| Daily mean °C (°F) | 2.8 (37.0) |
3.0 (37.4) |
5.5 (41.9) |
9.0 (48.2) |
12.5 (54.5) |
15.4 (59.7) |
17.5 (63.5) |
17.3 (63.1) |
14.1 (57.4) |
10.3 (50.5) |
6.3 (43.3) |
3.5 (38.3) |
9.8 (49.6) |
| Mean daily minimum °C (°F) | 0.1 (32.2) |
−0.1 (31.8) |
1.4 (34.5) |
3.7 (38.7) |
7.0 (44.6) |
9.9 (49.8) |
12.2 (54.0) |
11.9 (53.4) |
9.4 (48.9) |
6.3 (43.3) |
3.2 (37.8) |
0.8 (33.4) |
5.5 (41.9) |
| Record low °C (°F) | −22.0 (−7.6) |
−22.9 (−9.2) |
−18.4 (−1.1) |
−8.1 (17.4) |
−3.4 (25.9) |
0.1 (32.2) |
2.5 (36.5) |
3.2 (37.8) |
−1.0 (30.2) |
−6.9 (19.6) |
−13.6 (7.5) |
−22.0 (−7.6) |
−22.9 (−9.2) |
| Average precipitation mm (inches) | 72.7 (2.86) |
54.7 (2.15) |
54.1 (2.13) |
41.3 (1.63) |
57.9 (2.28) |
65.0 (2.56) |
85.0 (3.35) |
77.8 (3.06) |
75.4 (2.97) |
71.4 (2.81) |
70.0 (2.76) |
79.4 (3.13) |
804.7 (31.68) |
| Average relative humidity (%) | 89.5 | 87.0 | 82.8 | 77.5 | 77.3 | 79.0 | 79.8 | 81.3 | 84.8 | 87.6 | 91.1 | 91.2 | 84.1 |
| Mean monthly sunshine hours | 60.7 | 86.1 | 139.0 | 188.7 | 218.0 | 198.6 | 212.3 | 196.3 | 150.7 | 112.9 | 63.4 | 56.1 | 1,682.8 |
| Percent possible sunshine | 24.0 | 30.8 | 37.7 | 45.0 | 44.4 | 39.3 | 41.8 | 42.8 | 39.4 | 34.2 | 24.2 | 23.7 | 35.6 |
| Source: Royal Netherlands Meteorological Institute[3][4] | |||||||||||||
References
[edit]- ^ Ad van der Meer and Onno Boonstra, Repertorium van Nederlandse gemeenten, KNAW, 2011.
- ^ Statistics Netherlands (CBS)
- ^ "Weerstatistieken Eelde". Royal Netherlands Meteorological Institute. Retrieved July 2, 2022.
- ^ "Klimaatviewer 1991-2020". Royal Netherlands Meteorological Institute. Retrieved July 2, 2022.
External links
[edit] Media related to Eelde at Wikimedia Commons
- Eelde, een lied van George Welling on YouTube
Licensed under CC BY-SA 3.0 | Source: https://en.wikipedia.org/wiki/Eelde7 views | ↧ Download as ZWI file
 KSF
KSF
