Gongguan, Miaoli
 From Wikipedia - Reading time: 7 min
24°30′19″N 120°50′41″E / 24.505269°N 120.844749°E
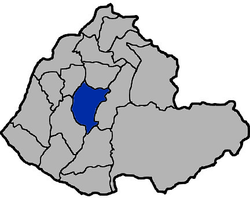
Gonguan Township 公館鄉 | |
|---|---|
 | |
 Gongguan Township in Miaoli County | |
| Location | Miaoli County, Taiwan |
| Area | |
• Total | 71 km2 (27 sq mi) |
| Population (September 2023) | |
• Total | 31,327 |
| • Density | 440/km2 (1,100/sq mi) |
| Website | www |
Gongguan Township (Chinese: 公館鄉; pinyin: Gōngguǎn Xiāng) is a rural township near the center of Miaoli County, Taiwan. Its climate is sub-tropical, mild and very rainy. The yearly average humidity is 80%.[1]
Geography
[edit]Gongguan occupies an area of 71.45 square kilometres (27.59 sq mi).[1] As of September 2023, it had 10,980 households and a total population of 31,327.[2]
Administrative divisions
[edit]The township comprises 19 villages: Beihe, Dakeng, Fude, Fuji, Fuxing, Guannan, Guantung, Guanzhong, Hegang, Heshan, Jianshan, Kaikuang, Nanhe, Renan, Shiqiang, Wugu, Yugu, Yuquan and Zhongyi.[3]
Politics
[edit]The township is part of Miaoli County Constituency II electoral district for Legislative Yuan.
Economy
[edit]Oil and gas has been discovered and explored in the area since more than a century ago.[4]
Transportation
[edit]- United Bus Gongguan Station
- Hsinchu Bus Gongguan Station
- Sun Yat-sen Freeway Miaoli Interchange
- Ta1 6 Line
- County Road 128:Tongxiao - Sihu Hsiang Shuijiapu - Tongluo Hsiang - Gongguan Hsiang
- Miao 26-2:Miaoli City Sindong Street—Sindong Bridge-Gongguan Hsiang Beihe—Siyi Tunnel—Shihtan Hsiang
- Tai 72:EXPRESSWAY Houlong - Wenshui
- County Road 119甲:Kesu Bridge—Gongguan Along Mountain Way
- Xindong Bridge
Tourist attractions
[edit]- Miaoli Ceramics Museum
- Taiwan Oil Field Exhibition Hall
- Wugu Cultural Village
- Taiwan Seri-Apiculture and Entomology Education Park
Notable natives
[edit]- Yang Jih-sung, former forensic scientist
- Yuhan Su, jazz vibraphonist and composer
Climate
[edit]| Climate data for Gongguan, Miaoli (1991–2020 normals, extremes 1995–present) | |||||||||||||
|---|---|---|---|---|---|---|---|---|---|---|---|---|---|
| Month | Jan | Feb | Mar | Apr | May | Jun | Jul | Aug | Sep | Oct | Nov | Dec | Year |
| Record high °C (°F) | 31.3 (88.3) |
34.0 (93.2) |
33.8 (92.8) |
37.0 (98.6) |
38.0 (100.4) |
38.1 (100.6) |
39.2 (102.6) |
39.9 (103.8) |
40.0 (104.0) |
37.3 (99.1) |
34.1 (93.4) |
31.3 (88.3) |
40.0 (104.0) |
| Mean daily maximum °C (°F) | 19.9 (67.8) |
20.3 (68.5) |
22.7 (72.9) |
26.6 (79.9) |
29.7 (85.5) |
32.0 (89.6) |
33.3 (91.9) |
32.7 (90.9) |
31.6 (88.9) |
28.8 (83.8) |
25.8 (78.4) |
21.8 (71.2) |
27.1 (80.8) |
| Daily mean °C (°F) | 15.0 (59.0) |
15.6 (60.1) |
17.8 (64.0) |
21.7 (71.1) |
25.0 (77.0) |
27.4 (81.3) |
28.4 (83.1) |
27.9 (82.2) |
26.4 (79.5) |
23.5 (74.3) |
20.5 (68.9) |
16.8 (62.2) |
22.2 (71.9) |
| Mean daily minimum °C (°F) | 11.6 (52.9) |
12.2 (54.0) |
14.3 (57.7) |
18.0 (64.4) |
21.3 (70.3) |
24.0 (75.2) |
24.8 (76.6) |
24.5 (76.1) |
22.7 (72.9) |
19.7 (67.5) |
16.7 (62.1) |
13.0 (55.4) |
18.6 (65.4) |
| Record low °C (°F) | 1.4 (34.5) |
3.6 (38.5) |
5.1 (41.2) |
6.8 (44.2) |
12.4 (54.3) |
16.4 (61.5) |
21.8 (71.2) |
21.6 (70.9) |
16.4 (61.5) |
9.9 (49.8) |
5.8 (42.4) |
1.9 (35.4) |
1.4 (34.5) |
| Average precipitation mm (inches) | 52.5 (2.07) |
85.9 (3.38) |
130.9 (5.15) |
146.3 (5.76) |
217.5 (8.56) |
282.8 (11.13) |
198.0 (7.80) |
283.3 (11.15) |
167.6 (6.60) |
38.1 (1.50) |
34.3 (1.35) |
40.6 (1.60) |
1,677.8 (66.05) |
| Average precipitation days | 6.2 | 7.6 | 10.1 | 9.6 | 10.3 | 11.6 | 9.0 | 11.4 | 7.2 | 3.4 | 4.7 | 5.9 | 97 |
| Average relative humidity (%) | 83.0 | 84.4 | 83.6 | 82.8 | 82.4 | 80.1 | 80.1 | 82.7 | 84.1 | 81.3 | 81.8 | 81.4 | 82.3 |
| Mean monthly sunshine hours | 135.1 | 112.7 | 145.2 | 155.7 | 178.1 | 198.5 | 229.1 | 210.8 | 214.5 | 212.5 | 162.1 | 143.5 | 2,097.8 |
| Source: Central Weather Administration (precipitation days 1995–2020, sun 2008–2020)[5] | |||||||||||||
References
[edit]- ^ a b 地理環境 [Geography & Environment]. kungkuan.gov.tw (in Chinese). GonguangTownship Office. Retrieved 2017-02-25.
- ^ 106年一月份人口統計下載區 [January 2017 Population Statistic Downloads]. mlhr.miaoli.gov.tw (in Chinese). Miaoli County Government Household Registration Service. January 2017. Retrieved 2017-02-25.
- ^ 轄區介紹 [Jurisdiction]. kungkuan.gov.tw (in Chinese). GonguangTownship Office. Retrieved 2017-02-25.
- ^ "CPC Corp, Taiwan finds gas reserves at old Miaoli well - Taipei Times". Archived from the original on 2019-05-08. Retrieved 2014-10-02.
- ^ "農業氣象觀測網監測系統 : 苗栗農改(K2E360)". Central Weather Administration. Retrieved 13 October 2024.
External links
[edit]- Official website
 (in Chinese)
 KSF
KSF