Irati, Paraná
 From Wikipedia - Reading time: 6 min
Irati | |
|---|---|
Municipality | |
 Church of São Miguel | |
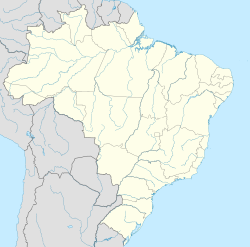
 Location of Irati | |
| Coordinates: 25°28′11″S 50°39′17″W / 25.46972°S 50.65472°W | |
| Country | |
| Region | Southern |
| State | Paraná |
| Mesoregion | Sudeste Paranaense |
| Population (2022)[1] | |
• Total | 59,250 |
| • Density | 153.5/sq mi (59.28/km2) |
| Time zone | UTC−3 (BRT) |

Irati is a municipality in the state of Paraná in Brazil, located in the southeastern region of the state. Its population at the 2022 census was 59,250. The main ethnicities are especially Poles and Ukrainians, who seek to maintain customs and traditions of their ancestors.
Irati sprang up in the 1890s as a railroad town along the São Paulo – Rio Grande do Sul railroad line. The name, Irati, comes from the Tupi language and reportedly means "river of honey" (apparently there were many bees in the region).
A distinguishing feature of many small towns in southern Brazil is the municipal anthem.
Climate
[edit]Irati has an oceanic climate (Köppen]: Cfb) with warm summers, mild winters, and abundant rainfall.
| Climate data for Irati, Paraná (1991–2020) | |||||||||||||
|---|---|---|---|---|---|---|---|---|---|---|---|---|---|
| Month | Jan | Feb | Mar | Apr | May | Jun | Jul | Aug | Sep | Oct | Nov | Dec | Year |
| Mean daily maximum °C (°F) | 27.4 (81.3) |
27.3 (81.1) |
26.6 (79.9) |
24.6 (76.3) |
20.8 (69.4) |
19.7 (67.5) |
20.0 (68.0) |
22.1 (71.8) |
23.0 (73.4) |
24.5 (76.1) |
26.0 (78.8) |
27.2 (81.0) |
24.1 (75.4) |
| Daily mean °C (°F) | 21.2 (70.2) |
21.1 (70.0) |
20.1 (68.2) |
17.8 (64.0) |
14.4 (57.9) |
13.4 (56.1) |
12.9 (55.2) |
14.4 (57.9) |
16.1 (61.0) |
18.1 (64.6) |
19.3 (66.7) |
20.8 (69.4) |
17.5 (63.5) |
| Mean daily minimum °C (°F) | 17.2 (63.0) |
17.2 (63.0) |
16.0 (60.8) |
13.6 (56.5) |
10.2 (50.4) |
9.2 (48.6) |
8.2 (46.8) |
9.1 (48.4) |
11.3 (52.3) |
13.8 (56.8) |
14.7 (58.5) |
16.4 (61.5) |
13.1 (55.6) |
| Average precipitation mm (inches) | 199.4 (7.85) |
161.5 (6.36) |
128.2 (5.05) |
106.2 (4.18) |
118.4 (4.66) |
137.7 (5.42) |
109.0 (4.29) |
86.2 (3.39) |
155.6 (6.13) |
186.1 (7.33) |
129.6 (5.10) |
149.8 (5.90) |
1,667.7 (65.66) |
| Average precipitation days (≥ 1.0 mm) | 14.1 | 12.4 | 10.0 | 7.0 | 7.0 | 7.6 | 6.6 | 6.0 | 9.1 | 11.6 | 9.6 | 12.3 | 113.3 |
| Average relative humidity (%) | 80.7 | 81.5 | 81.2 | 81.4 | 83.8 | 85.1 | 81.6 | 76.6 | 77.2 | 79.5 | 76.3 | 78.4 | 80.3 |
| Average dew point °C (°F) | 18.4 (65.1) |
18.4 (65.1) |
17.4 (63.3) |
15.4 (59.7) |
12.6 (54.7) |
11.7 (53.1) |
10.7 (51.3) |
11.1 (52.0) |
12.8 (55.0) |
15.0 (59.0) |
15.6 (60.1) |
17.4 (63.3) |
14.7 (58.5) |
| Mean monthly sunshine hours | 162.7 | 141.5 | 161.3 | 157.0 | 141.0 | 131.5 | 158.1 | 177.8 | 140.7 | 142.7 | 169.8 | 172.0 | 1,856.1 |
| Source: NOAA[2] | |||||||||||||
Notable people
[edit]- Eliana Michaelichen Bezerra – TV hostess, actress and singer
- Pedro Muffato – politician, businessman and racing driver
References
[edit]- ^ "Panorama: Irati". IGBE. Instituto Brasileiro de Geografia e Estatística. Retrieved May 10, 2023.
- ^ "World Meteorological Organization Climate Normals for 1991-2020 — Irati". National Oceanic and Atmospheric Administration. Retrieved January 30, 2024.
External links
[edit]Licensed under CC BY-SA 3.0 | Source: https://en.wikipedia.org/wiki/Irati,_Paraná24 views | Status: cached on August 12 2025 02:26:05↧ Download as ZWI file
 KSF
KSF
