Jinshan District, New Taipei
 From Wikipedia - Reading time: 7 min
Jinshan
金山區 Kanayama | |
|---|---|
| Jinshan District | |
 | |
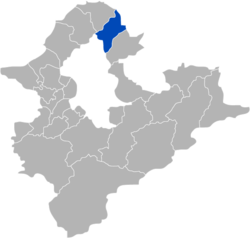
 Jinshan District in New Taipei City | |
| Coordinates: 25°14′10″N 121°37′03″E / 25.23611°N 121.61750°E | |
| Country | Republic of China (Taiwan) |
| Region | Northern Taiwan |
| Special municipality | New Taipei City (新北市) |
| Area | |
• Total | 49.21 km2 (19.00 sq mi) |
| Population (March 2023) | |
• Total | 20,551 |
| • Density | 418/km2 (1,080/sq mi) |
| Time zone | UTC+8 (CST) |
| Postal code | 208 |
| Website | www |
| Jinshan District | |||||||||||||||||||
|---|---|---|---|---|---|---|---|---|---|---|---|---|---|---|---|---|---|---|---|
| Chinese | 金山區 | ||||||||||||||||||
| Literal meaning | Golden Mountain | ||||||||||||||||||
| |||||||||||||||||||

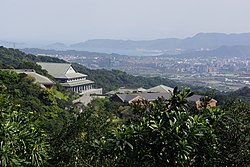
Jinshan District (Chinese: 金山區) is a rural district on the coast in northern New Taipei, Taiwan. The district draws many visitors each year because of its hot springs and its proximity to Chin Pao San and the Ju Ming Museum. The district is home to the Dharma Drum Buddhist College, an institution of higher learning founded by Dharma Drum Mountain monastics devoted to the principles of Zen Buddhism.[1]
Name Origin
[edit]This area was originally a Ketagalan settlement, called "Ki-ppare" (Basay: Quimourije),[2] meaning "bumper harvest". This was later adapted as Kimpauli (金包里; Pe̍h-ōe-jī: Kim-pau-lí), the choice of characters perhaps influenced by the discovery of golden dust in the Sulfur creeks.[3] In 1920 during Japanese rule, the area was renamed Kanayama Village (金山庄), Kīrun District (基隆郡), Taihoku Prefecture.
Qingshui Wetland
[edit]Adjacent to Jinshan town at the north-west is a lowland wetland formed by alluvial deposits from Sulphur Creek (磺溪), Xishi Creek (西勢溪) and Qingshui Creek (清水溪). It is the last resting point in Taiwan for many migratory birds heading north during Spring and the first in the country for those heading south during Autumn.[4] It has also served as habitat for rare vagrants such as the critically endangered Siberian Crane (Leucogeranus leucogeranus)[4] and endangered Red-Crowned Crane (Grus japonensis).[5]
Geography
[edit]- Area: 49.21 km2
- Population: 20,551 people (March 2023)
Education
[edit]- Jinshan Senior High School (grades 7-12)
- Jinshan Elementary School
- Zhongjiao National Elementary School
- Sanhe National Elementary School
- Jinmeimin Elementary School
Tourist attractions
[edit]Infrastructure
[edit]Notable natives
[edit]- Lee Hong-chi, actor
Climate
[edit]| Climate data for Jinshan District, New Taipei (2010–2023 normals, extremes 2010–present) | |||||||||||||
|---|---|---|---|---|---|---|---|---|---|---|---|---|---|
| Month | Jan | Feb | Mar | Apr | May | Jun | Jul | Aug | Sep | Oct | Nov | Dec | Year |
| Record high °C (°F) | 26.3 (79.3) |
30.2 (86.4) |
31.1 (88.0) |
33.7 (92.7) |
35.6 (96.1) |
37.9 (100.2) |
37.7 (99.9) |
40.2 (104.4) |
38.4 (101.1) |
34.8 (94.6) |
31.8 (89.2) |
29.8 (85.6) |
40.2 (104.4) |
| Mean daily maximum °C (°F) | 18.1 (64.6) |
18.8 (65.8) |
21.1 (70.0) |
24.6 (76.3) |
27.7 (81.9) |
31.1 (88.0) |
33.9 (93.0) |
33.6 (92.5) |
31.0 (87.8) |
26.4 (79.5) |
23.4 (74.1) |
19.3 (66.7) |
25.8 (78.4) |
| Daily mean °C (°F) | 15.4 (59.7) |
15.7 (60.3) |
17.4 (63.3) |
20.5 (68.9) |
23.9 (75.0) |
27.0 (80.6) |
28.9 (84.0) |
28.7 (83.7) |
26.8 (80.2) |
23.6 (74.5) |
20.8 (69.4) |
16.8 (62.2) |
22.1 (71.8) |
| Mean daily minimum °C (°F) | 13.2 (55.8) |
13.2 (55.8) |
14.4 (57.9) |
17.4 (63.3) |
21.0 (69.8) |
23.8 (74.8) |
25.2 (77.4) |
25.1 (77.2) |
23.7 (74.7) |
21.3 (70.3) |
18.5 (65.3) |
14.5 (58.1) |
19.3 (66.7) |
| Record low °C (°F) | 3.4 (38.1) |
5.1 (41.2) |
6.3 (43.3) |
9.4 (48.9) |
13.2 (55.8) |
16.7 (62.1) |
22.5 (72.5) |
20.9 (69.6) |
18.3 (64.9) |
13.4 (56.1) |
9.6 (49.3) |
4.5 (40.1) |
3.4 (38.1) |
| Average precipitation mm (inches) | 247.4 (9.74) |
281.5 (11.08) |
240.7 (9.48) |
208.2 (8.20) |
319.8 (12.59) |
301.9 (11.89) |
114.6 (4.51) |
170.2 (6.70) |
278.4 (10.96) |
224.4 (8.83) |
245.3 (9.66) |
289.2 (11.39) |
2,921.6 (115.03) |
| Average precipitation days | 17.7 | 16.6 | 16.5 | 14.6 | 14.7 | 12.5 | 7.7 | 10.3 | 12.2 | 13.6 | 15.9 | 17.4 | 169.7 |
| Average relative humidity (%) | 84.0 | 86.9 | 85.5 | 84.5 | 86.6 | 84.4 | 78.3 | 80.0 | 81.6 | 82.1 | 85.1 | 83.6 | 83.6 |
| Mean monthly sunshine hours | 60.7 | 51.1 | 81.7 | 93.0 | 113.4 | 125.0 | 204.7 | 201.7 | 146.1 | 97.2 | 60.2 | 43.7 | 1,278.5 |
| Source 1: Central Weather Administration (sun 1995–2008)[6] | |||||||||||||
| Source 2: Atmospheric Science Research and Application Databank (precipitation 1995–2020, precipitation days and humidity 2000–2024)[7] | |||||||||||||
See also
[edit]References
[edit]- ^ "Dharma Drum University". Ddc.edu.tw. Archived from the original on 2013-09-21. Retrieved 2014-04-23.
- ^ 翁佳音 (1998). 大台北古地圖考釋 (in Chinese). Taipei: 台北縣立文化中心. ISBN 9789570220841.
- ^ 李世榮; 吳立萍 (2003). 台灣的老鄉鎮 (in Chinese). Xindian: 遠足文化事業股份有限公司. pp. 22-25. ISBN 957280314X.
- ^ a b New Taipei City Water Resources Department (in Mandarin) (26 October 2021). "Qingshui Wetland". Water New Taipei. Retrieved 26 October 2021.
- ^ "【百年難得一見】 3瀕危鳥種齊聚新北 | 蘋果新聞網 | 蘋果日報". 蘋果新聞網 (in Chinese (Taiwan)). 2015-12-18. Retrieved 2021-10-26.
- ^ "月報表(逐日資料) : 金山 (C0A940)". Central Weather Administration. Retrieved 7 October 2024.
- ^ "中央氣象署 測站氣候資料 : 新北金山 C0A940". Atmospheric Science Research and Application Databank. Retrieved 7 October 2024.
External links
[edit]- Official website
 (in Chinese)
 KSF
KSF