Lists of national parks
 From Wikipedia - Reading time: 6 min

This is a list of the number of national parks per nation, as defined by the International Union for Conservation of Nature. Nearly 100 countries around the world have lands classified as a national park by this definition.
Note that this article links to list articles of national parks by country on Wikipedia in the "Country" column in the tables.
Africa
[edit]

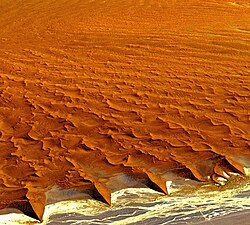
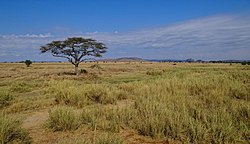
| Country | Oldest (year) |
Number of parks |
Total area km2 |
Percentage of country |
|---|---|---|---|---|
| Algeria | 11 | 527,661.68 | 22.1% | |
| Angola | 8 | |||
| Ascension Island[3] | 2005 | 1 | ||
| Benin | 2 | |||
| Botswana | 1968 | 4 | 56,258 | 9.67% |
| Burkina Faso | 1954 | 4 | ||
| Burundi | 1934 | 3 | 1,014 | 3.6% |
| Cameroon | 27 | |||
| Cape Verde | 1 | |||
| Central African Republic | 5 | |||
| Chad | 1963 | 4 | 14,540 | 1.13% |
| Comoros | 2010 | 6 | 1,165.77 | 52.16% |
| Democratic Republic of the Congo | 1925 | 9 | ||
| Republic of the Congo | 5 | |||
| Côte d'Ivoire | 1953 | 9 | ||
| Djibouti | 3 | |||
| Egypt | 1983 | 5 | 4,353 | 4.3% |
| Equatorial Guinea | 3 | |||
| Eritrea | 2 | |||
| Eswatini | 1967 | 1 | 300 | 1.74% |
| Ethiopia | 1959 | 22 | ||
| Gabon | 2002 | 13 | 26,766 | 10.0% |
| Gambia | 1978 | 5 | 169.9 | 1.5% |
| Ghana | 1971 | 7 | ||
| Guinea | 3 | |||
| Guinea-Bissau | 6 | |||
| Kenya | 1946 | 24 | ||
| Lesotho | 2 | |||
| Liberia | 8 | |||
| Libya | 6 | |||
| Madagascar | 1958 | 26 | 14,327 | 2.4% |
| Malawi | 1966 | 6 | ||
| Mali | 4 | |||
| Mauritania | 2 | |||
| Mauritius | 1994 | 3 | 7,160 | 3.5% |
| Morocco | 1942 | 12 | ||
| Mozambique | 1960 | 7 | 40,970 | 5.1% |
| Namibia | 20 | 10,878 | 13.2% | |
| Niger | 1954 | 1 | ||
| Nigeria | 1979 | 8 | 20,156 | 3.0% |
| Rwanda | 3 | |||
| Sao Tome and Principe | 1 | |||
| Senegal | 6 | |||
| Seychelles | 1973 | 9 | ||
| Sierra Leone | 1986 | 8 | ||
| Somalia | 6 | |||
| South Africa | 1926 | 21 | 37,000 | 3% |
| South Sudan | 6 | |||
| Sudan | 4 | |||
| Tanzania[4] | 1951 | 23 | 99,306.5 | |
| Togo | 3 | |||
| Tunisia | 1980 | 17 | ||
| Uganda | 1952 | 10 | ||
| Zambia | 28 | 240,836.48 | 32% | |
| Zimbabwe | 11 |
Asia
[edit]
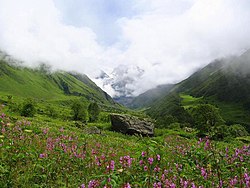
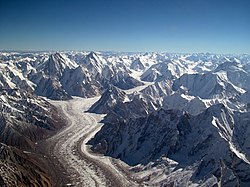
| Country | Oldest (year) |
Number of parks |
Total area km² |
Percentage of country |
|---|---|---|---|---|
| Afghanistan | 2009 | 2 | 11,516.28 | |
| Armenia | 1978 | 4 | 1,176 | |
| Azerbaijan | 2003 | 11 | ||
| Bangladesh | 18 | |||
| Bhutan | 5 | 8,008 | 20.8% | |
| Brunei | 2 | |||
| Cambodia | 1993 | 13 | 7,422.5 | 4.1% |
| China | 916 | 8 | ||
| Georgia | 11 | |||
| India | 1936 | 116 | 38,136 | 1.16% |
| Indonesia | 1980 | 56 | 160,520 | 8.43% |
| Iran | 1974 | 23 | 19,757 | 1.2% |
| Iraq | 2 | |||
| Israel | 1964 | 49 | 6,400 | 30% |
| Japan | 1934 | 34 | 20,482 | 5.4% |
| Jordan | ||||
| Kazakhstan | 1985 | 13 | 18,876 | 0.7% |
| Kyrgyzstan | 1976 | 13 | 7,246.7 | 3.625% |
| Lebanon | 4 | |||
| Maldives | ||||
| Malaysia | 29 | |||
| Mongolia | 1783[5][6][7] | 29 | ||
| Myanmar | 1982 | 9 | 10,351 | 1.5% |
| Nepal | 1973 | 12 | 34,426 | 23.39% |
| North Korea | 9 | |||
| Oman | 1997 | 1 | 220 | 0.07% |
| Pakistan | 1972 | 26 | 132,919.71 | 6.63% |
| Philippines | 1933 | 36 | 1,820 | 0.6% |
| Qatar | ||||
| Russia | 1983 | 64 | 155,672 | |
| Saudi Arabia | 3 | |||
| South Korea | 1967 | 22 | 6,726 | 6.70%[8] |
| Sri Lanka | 1938 | 26 | ||
| Republic of China (Taiwan) | 1984 | 9 | 3,104 | 8.6% |
| Tajikistan | 1992 | 1 | 26,000 | 18% |
| Timor-Leste | 2007 | 1 | 1,236 | 8.27% |
| Thailand | 1961 | 156 | 61,413 | 11.96% |
| Turkey | 1958 | 43 | 8,481 | 1% |
| United Arab Emirates | 4 | |||
| Uzbekistan | 4 | |||
| Vietnam | 1962 | 32 | ||
| Yemen | 2 |
Europe
[edit]




| Country | Oldest (year) |
Number of parks |
Total area km² |
Percentage of country |
|---|---|---|---|---|
| Albania | 1966 | 14 | 2,106.68 | 6.7% |
| Austria | 1981 | 7 | 2,521 | 3.0% |
| Belarus | 1939 | 4 | 2,222 | 1.0% |
| Belgium | 2001 | 6 | 638.71 | 2.1% |
| Bosnia and Herzegovina | 1965 | 4 | 473 | 0.9% |
| Bulgaria | 1963 | 3 | 1,930 | 1.8% |
| Croatia | 1949 | 8 | 994 | 1.8% |
| Czech Republic | 1963 | 4 | 1,190 | 1.5% |
| Denmark[note 1] | 2008 | 5 | 2,322 | 5.4% |
| Estonia | 1971 | 6 | 2,370 | 5.2% |
| Finland | 1956 | 40 | 9,892[9] | 2.9% |
| France[note 2] | 1963 | 11[10] | 60,728[11] | 9.5% |
| Georgia | 1946 | 11 | 5,111 | 7.0% |
| Germany | 1970 | 16 | 10,395 | 2.7% |
| Greece | 1938 | 15 | 6,960 | 3.6% |
| Hungary | 1972 | 10 | 4,819 | 5.2% |
| Iceland | 1928 | 3 | 12,407 | 12.1% |
| Ireland | 1932 | 6 | 650 | 0.9% |
| Italy | 1922 | 25 | 15,000 | 5.0% |
| Kosovo | 1986 | 2 | 1,014.88 | 9.3% |
| Latvia | 1973 | 4 | 2,065 | 3.2% |
| Lithuania | 1974 | 5 | 1,554 | 2.4% |
| Malta | 2007 | 1 | 2.5 | 0.69% |
| Moldova | 2013 | 1 | 337 | 1% |
| Montenegro | 1952 | 5 | 1,096 | 7.9% |
| Netherlands | 1930 | 21 | 1,251 | 3.0% |
| North Macedonia | 1948 | 3 | 974 | 3.8% |
| Norway | 1962 | 47 | 24,060 | 6.3% |
| Poland | 1932 | 23 | 3,149 | 1.0% |
| Portugal | 1971 | 1 | 702 | 0.8% |
| Romania | 1935 | 14 | 3,158 | 1.3% |
| Russia | 1983 | 48 | 141,200 | 0.82% |
| Serbia | 1960 | 7 | 1,936 | 2.19% |
| Slovakia | 1949 | 9 | 3,690 | 7.5% |
| Slovenia | 1961 | 1 | 838 | 4.1% |
| Spain | 1918 | 16 | 3,845 | 0.8% |
| Sweden | 1909 | 30 | 7,199 | 1.6% |
| Switzerland | 1914 | 1 | 170 | 0.4% |
| Turkey | 1958 | 50 | 9,288 | 1.0% |
| Ukraine | 1980 | 48 | 7,020 | 1.2% |
| United Kingdom | 1951 | 15 | 19,989 | 8.2% |
- Links to lists of national parks by region
North and Central America
[edit]


| Country | Oldest (year) |
Number of parks |
Total area km2 |
Percentage of country |
|---|---|---|---|---|
| Antigua and Barbuda | 6 | |||
| Aruba | 1 | |||
| Bahamas | 40 | |||
| Barbados | 1 | |||
| Belize | 1986 | 18 | 1,701 | 7.4% |
| British Virgin Islands | 14 | |||
| Canada | 1885 | 47 | 377,000 | 3.78% |
| Costa Rica | 1955 | 29 | 12,913 | 25.1% |
| Cuba | 14 | |||
| Curacao | 1978 | 2 | 20.8 | 4.68% |
| Dominica | 1975 | 3 | 107 | 7.01% |
| Dominican Republic | 1956 | 29 | ||
| El Salvador | 8 | |||
| Grenada | 3 | |||
| Guatemala | 1955 | 22 | ||
| Haiti | 1983 | 16 | 88 | 0.31% |
| Honduras | 18 | |||
| Jamaica | 1 | |||
| Mexico | 1917 | 67 | 14,320 | 0.73% |
| Nicaragua | 1979 | 3 | 25,327 | 17.3% |
| Panama | 1966 | 16 | 12,520[12] | 16.57% |
| Saint Kitts & Nevis | 5 | |||
| Saint Lucia | 2 | |||
| Saint Vincent and the Grenadines | 1 | |||
| Trinidad & Tobago | 1 | |||
| Turks and Caicos Islands | 11 | |||
| United States (excluding territories) | 1872 | 61 | 210,000 | 2.19% |
| US Virgin Islands | 1 |
South America
[edit]
| Country | Oldest (year) |
Number of parks |
Total area km² |
Percentage of country |
|---|---|---|---|---|
| Argentina[13] | 1922 | 37 | 38,452 | 1.38% |
| Bolivia | 1939 | 13 | 65,910 | 6% |
| Brazil[14] | 1937 | 75 | 250,000 | 2.968% |
| Chile[15] | 1926 | 41 | 146,046 | 19.3% |
| Colombia | 1960 | 60 | 169,545 | 12.5% |
| Ecuador | 1959 | 12 | 34,733 | 12.2% |
| Guyana | 1929 | 1 | ||
| Paraguay | 1948 | 15 | 60,662 | 14.9% |
| Peru | 1961 | 15 | 79,665 | 6.2% |
| Uruguay | 1937 | 7 | ||
| Venezuela | 1937 | 46 | 199,418 | 21.76% |
- French Guiana: see France
Oceania
[edit]

.
| Country | Oldest (year) |
Number of parks |
Total area km² |
Percentage of country |
|---|---|---|---|---|
| American Samoa | 1 | |||
| Australia | 1879 | 685 | 335,062 | 4.36% |
| Cook Islands | 1 | |||
| Fiji | 1987 | 1 | ||
| New Zealand | 1887 | 13 | 28,873 | 10.8% |
| Papua New Guinea | 8 | |||
| Samoa | 5 | |||
| Solomon Islands | 1 | |||
| Tonga | 1992 | 4 |
- Hawaii: see United States
- Easter Island: see Chile
See also
[edit]Notes
[edit]- ^ Refers to mainland Denmark only (part in Europe). For Greenland, see Northeast Greenland National Park, Greenland's only national park, which was established in 1974 and is the world's largest at 971,000 km² (44.8% of Greenland's area).
- ^ Includes overseas departments (outside Europe) where there are three national parks: the 33,900 km² Guiana Amazonian Park in French Guiana, 1,054 km² Réunion National Park in Réunion and 173 km² Guadeloupe National Park in Guadeloupe.
References
[edit]- ^ "What was the first national park?". Britannica.com. Encyclopædia Britannica, Inc.
- ^ "Evolution of the Conservation Movement, 1850-1920". American Memory - Library of Congress. Archived from the original on 23 January 2017.
- ^ "Green Mountain - Ascension Island Government". Retrieved 3 October 2022.
- ^ "TANAPA History". tanzaniaparks.go.tz (in English and Swahili). Dodoma, Tanzania: Tanzania National Parks Authority. Archived from the original on 28 June 2022. Retrieved 11 September 2022.
By September 2019, TANAPA has grown to 22 national parks, covering approximately 99,306.5 square Kilometers
- ^ Hardy, U. (9 April 2017). "The 10 Oldest National Parks In The World". The CultureTrip. Retrieved 21 December 2017.
- ^ Whitten, T. (28 April 2009). "Mongolia: tough decisions about the world's oldest nature reserve". The World Bank. Retrieved 21 December 2017.
- ^ Bonnett, A. (2016). The Geography of Nostalgia: Global and Local Perspectives on Modernity and Loss. Routledge. p. 68. ISBN 978-1-315-88297-0.
- ^ "e-나라지표 국립공원현황". Statistics Korea. Retrieved 12 July 2020.
- ^ Number and Size of Protected Areas Managed by Metsähallitus Number and Size of Protected Areas Managed by Metsähallitus, Metsähallitus, retrieved 2016-11-30
- ^ Les parcs nationaux 11 espaces naturels proteges, Parcs nationaux de France, retrieved 2024-12-27
- ^ Les dix parcs nationaux français, Parcs nationaux de France, archived from the original on 2012-08-05, retrieved 2012-07-22
- ^ "Parques Nacionales: Espacios de riquezas invaluables - MiAmbiente". 24 August 2021.
- ^ "Sistema de Información de Biodiversidad - Áreas Protegidas" (in Spanish). Retrieved 11 July 2017.
- ^ "Federal conservation units of Brasil". Archived from the original on July 26, 2014. Retrieved September 25, 2012.
- ^ Corporación Nacional Forestal (Chile National Forest Corporation), retrieved 19 July 2017
- ^ "Áreas Silvestres Protegidas del Paraguay. SINASIP" (PDF). Awsassets.panda.org. Retrieved 5 February 2019.
Licensed under CC BY-SA 3.0 | Source: https://en.wikipedia.org/wiki/Lists_of_national_parks18 views | Status: cached on July 10 2025 20:55:36↧ Download as ZWI file
 KSF
KSF