Martin, Tennessee
 From Wikipedia - Reading time: 9 min
Martin, Tennessee | |
|---|---|
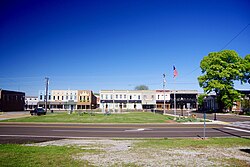
 Businesses along Lindell Street | |
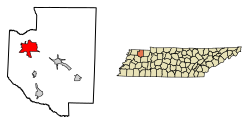
 Location of Martin in Weakley County, Tennessee. | |
| Coordinates: 36°20′31″N 88°51′6″W / 36.34194°N 88.85167°W | |
| Country | United States |
| State | Tennessee |
| County | Weakley |
| Area | |
• Total | 12.45 sq mi (32.24 km2) |
| • Land | 12.40 sq mi (32.13 km2) |
| • Water | 0.04 sq mi (0.11 km2) |
| Elevation | 407 ft (124 m) |
| Population | |
• Total | 10,825 |
| • Density | 872.63/sq mi (336.92/km2) |
| Time zone | UTC-6 (Central (CST)) |
| • Summer (DST) | UTC-5 (CDT) |
| ZIP codes | 38237-38238 |
| Area code | 731 |
| FIPS code | 47-46240[4] |
| GNIS feature ID | 1292789[2] |
| Website | http://www.cityofmartin.net/ |
Martin is a city in Weakley County, Tennessee, United States. The population was 10,825 according to the 2020 census. The city is the home of the University of Tennessee at Martin.
History
[edit]Martin is named for Captain William Martin.[5] William Martin was born in Halifax County, Virginia in 1806, and moved to Weakley County, Tennessee with his wife Sarah in 1832.[5] Captain Martin prospered through tobacco farming and began working to establish a railroad connection in what would later become Martin in 1852.[5] It was not until after his death in 1859 that his sons, led primarily by George W. Martin, persuaded the Mississippi Central Railroad to locate a connection with the Nashville and Northwestern Railroad in what would become Martin, Tennessee in 1872.[5]
Geography
[edit]Martin is located at 36°20′31″N 88°51′6″W / 36.34194°N 88.85167°W (36.341836, -88.851647).[6]
According to the United States Census Bureau, the city has a total area of 12.4 square miles (32 km2), of which 12.4 square miles (32 km2) is land and 0.04 square miles (0.10 km2) (0.32%) is water.
Major roads and highways
[edit]- U.S. Route 45E (Elm St., Lindell St.)
- State Route 22
- State Route 431 (Main Street, University Street)
- State Route 43 (Skyhawk Parkway)
Climate
[edit]| Climate data for Martin, Tennessee (University of Tennessee at Martin) 1991–2020 normals, extremes 1936–present | |||||||||||||
|---|---|---|---|---|---|---|---|---|---|---|---|---|---|
| Month | Jan | Feb | Mar | Apr | May | Jun | Jul | Aug | Sep | Oct | Nov | Dec | Year |
| Record high °F (°C) | 77 (25) |
81 (27) |
86 (30) |
90 (32) |
98 (37) |
107 (42) |
105 (41) |
106 (41) |
105 (41) |
96 (36) |
87 (31) |
78 (26) |
107 (42) |
| Mean daily maximum °F (°C) | 45.9 (7.7) |
50.8 (10.4) |
59.5 (15.3) |
70.2 (21.2) |
78.8 (26.0) |
86.5 (30.3) |
89.8 (32.1) |
89.5 (31.9) |
83.4 (28.6) |
72.4 (22.4) |
59.6 (15.3) |
49.3 (9.6) |
69.6 (20.9) |
| Daily mean °F (°C) | 36.2 (2.3) |
40.5 (4.7) |
48.7 (9.3) |
58.7 (14.8) |
68.3 (20.2) |
76.3 (24.6) |
79.7 (26.5) |
78.4 (25.8) |
71.5 (21.9) |
59.7 (15.4) |
48.5 (9.2) |
39.8 (4.3) |
58.9 (14.9) |
| Mean daily minimum °F (°C) | 26.5 (−3.1) |
30.3 (−0.9) |
37.8 (3.2) |
47.3 (8.5) |
57.8 (14.3) |
66.2 (19.0) |
69.7 (20.9) |
67.4 (19.7) |
59.6 (15.3) |
47.1 (8.4) |
37.4 (3.0) |
30.2 (−1.0) |
48.1 (8.9) |
| Record low °F (°C) | −18 (−28) |
−14 (−26) |
−2 (−19) |
20 (−7) |
31 (−1) |
44 (7) |
48 (9) |
44 (7) |
33 (1) |
17 (−8) |
0 (−18) |
−13 (−25) |
−18 (−28) |
| Average precipitation inches (mm) | 4.18 (106) |
4.74 (120) |
5.32 (135) |
5.29 (134) |
5.66 (144) |
4.30 (109) |
4.24 (108) |
3.45 (88) |
3.77 (96) |
3.98 (101) |
4.48 (114) |
5.31 (135) |
54.72 (1,390) |
| Average snowfall inches (cm) | 1.2 (3.0) |
1.4 (3.6) |
0.4 (1.0) |
0.0 (0.0) |
0.0 (0.0) |
0.0 (0.0) |
0.0 (0.0) |
0.0 (0.0) |
0.0 (0.0) |
0.0 (0.0) |
0.1 (0.25) |
0.0 (0.0) |
3.1 (7.9) |
| Average precipitation days (≥ 0.01 in) | 10.6 | 9.7 | 11.6 | 10.9 | 11.9 | 9.6 | 8.2 | 7.7 | 7.6 | 8.2 | 9.4 | 11.5 | 116.9 |
| Average snowy days (≥ 0.1 in) | 0.9 | 0.9 | 0.1 | 0.0 | 0.0 | 0.0 | 0.0 | 0.0 | 0.0 | 0.0 | 0.1 | 0.3 | 2.3 |
| Source: NOAA[7][8] | |||||||||||||
Demographics
[edit]| Census | Pop. | Note | %± |
|---|---|---|---|
| 1900 | 1,730 | — | |
| 1910 | 2,228 | 28.8% | |
| 1920 | 2,837 | 27.3% | |
| 1930 | 3,300 | 16.3% | |
| 1940 | 3,587 | 8.7% | |
| 1950 | 4,082 | 13.8% | |
| 1960 | 4,750 | 16.4% | |
| 1970 | 7,781 | 63.8% | |
| 1980 | 8,898 | 14.4% | |
| 1990 | 8,600 | −3.3% | |
| 2000 | 10,515 | 22.3% | |
| 2010 | 11,473 | 9.1% | |
| 2020 | 10,825 | −5.6% | |
| Sources:[9][10][3] | |||
2020 census
[edit]| Race | Num. | Perc. |
|---|---|---|
| White (non-Hispanic) | 7,892 | 72.91% |
| Black or African American (non-Hispanic) | 1,910 | 17.64% |
| Native American | 14 | 0.13% |
| Asian | 131 | 1.21% |
| Other/Mixed | 549 | 5.08% |
| Hispanic or Latino | 329 | 3.04% |
As of the 2020 United States census, there were 10,825 people, 3,958 households, and 2,049 families residing in the city.
2000 census
[edit]At the 2000 census there were 10,515 people, 3,773 households, and 2,029 families living in the city. The population density was 848.9 inhabitants per square mile (327.8/km2). There were 4,106 housing units at an average density of 331.5 per square mile (128.0/km2). The racial makeup of the city was 66.32% White, 25.62% African American, 0.08% Native American, 4.13% Asian, 0.97% from other races, and 0.89% from two or more races. Hispanic or Latino of any race were 3.82%.[4]
Of the 3,773 households 24.0% had children under the age of 18 living with them, 41.1% were married couples living together, 9.9% had a female householder with no husband present, and 46.2% were non-families. 34.1% of households were one person and 11.5% were one person aged 65 or older. The average household size was 2.20 and the average family size was 2.87.
The age distribution was 16.7% under the age of 18, 32.6% from 18 to 24, 21.4% from 25 to 44, 16.4% from 45 to 64, and 12.9% 65 or older. The median age was 26 years. For every 100 females, there were 89.9 males. For every 100 females age 18 and over, there were 86.0 males.
The median household income was $26,493 and the median family income was $38,648. Males had a median income of $29,836 versus $22,219 for females. The per capita income for the city was $15,184. About 15.8% of families and 27.1% of the population were below the poverty line, including 27.7% of those under age 18 and 15.7% of those age 65 or over.
ZIP codes
[edit]The ZIP codes used in the Martin area are: 38237 and 38238, with the latter reserved for the University of Tennessee at Martin.
Media
[edit]Newspapers
[edit]- Weakley County Press
Radio
[edit]- WCMT-AM 1410 100.5FM
- WCMT-FM 101.3
- WUTM-FM 90.3
- (WCDZ FM 95.1 and 102.9FM)
- WCMT-AM 1410 "your best friend"
Points of interest
[edit]- University of Tennessee at Martin
- University of Tennessee Botanical Gardens
- Westview High School (Tennessee)
Notable people
[edit]- Chad Clifton - NFL player for the Green Bay Packers
- Leonard Hamilton - UTM alumnus, men's basketball coach, Florida State University
- Justin Harrell - NFL player for the Green Bay Packers
- Crystal Renee Hayslett - Actress and costume designer, known for BET's Sistas and BET+'s Zatima
- Lester Hudson - UTM alumnus, NBA player
- Pat Summitt - UTM alumna, Head Coach emerita, UT Knoxville Lady Vols Basketball
- Jerry Reese - UTM alumnus, General Manager, New York Giants (football)
- Hayden White - narrative historian.
- Lin Dunn - UTM alumna, first coach and general manager for the Seattle Storm (basketball)
- Van Jones - UTM alumnus, CNN commentator, Emmy award winner
- Ty Simpson - Westview alumnus, quarterback for Alabama Crimson Tide
See also
[edit]References
[edit]- ^ "ArcGIS REST Services Directory". United States Census Bureau. Retrieved October 15, 2022.
- ^ a b U.S. Geological Survey Geographic Names Information System: Martin, Tennessee
- ^ a b "Census Population API". United States Census Bureau. Retrieved October 15, 2022.
- ^ a b "U.S. Census website". United States Census Bureau. Retrieved January 31, 2008.
- ^ a b c d "William Martin". www.utm.edu. Retrieved July 4, 2016.
- ^ "US Gazetteer files: 2010, 2000, and 1990". United States Census Bureau. February 12, 2011. Retrieved April 23, 2011.
- ^ "NowData - NOAA Online Weather Data". National Oceanic and Atmospheric Administration. Retrieved September 25, 2021.
- ^ "Station: Martin U of T Branch E, TN". U.S. Climate Normals 2020: U.S. Monthly Climate Normals (1991-2020). National Oceanic and Atmospheric Administration. Retrieved September 25, 2021.
- ^ "Census of Population and Housing: Decennial Censuses". United States Census Bureau. Retrieved March 4, 2012.
- ^ "Incorporated Places and Minor Civil Divisions Datasets: Subcounty Resident Population Estimates: April 1, 2010 to July 1, 2012". Population Estimates. U.S. Census Bureau. Archived from the original on June 11, 2013. Retrieved December 11, 2013.
- ^ "Explore Census Data". data.census.gov. Retrieved December 8, 2021.
 KSF
KSF