Mazon, Illinois
 From Wikipedia - Reading time: 7 min
Mazon | |
|---|---|
 The former Santa Fe station in Mazon | |
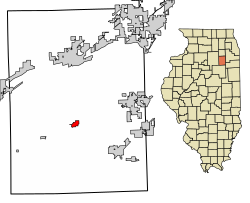
 Location of Mazon in Grundy County, Illinois. | |
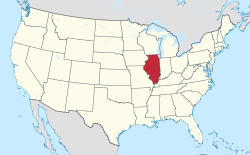
 Location of Illinois in the United States | |
| Coordinates: 41°14′30″N 88°25′23″W / 41.24167°N 88.42306°W[1] | |
| Country | United States |
| State | Illinois |
| County | Grundy |
| Government | |
| • Mayor | Jeffrey A. Marques (April 2021)[2] |
| Area | |
• Total | 0.61 sq mi (1.58 km2) |
| • Land | 0.60 sq mi (1.56 km2) |
| • Water | 0.01 sq mi (0.02 km2) |
| Elevation | 587 ft (179 m) |
| Population (2020) | |
• Total | 979 |
| • Density | 1,626.25/sq mi (628.06/km2) |
| Time zone | UTC-6 (CST) |
| • Summer (DST) | UTC-5 (CDT) |
| ZIP code | 60444 |
| Area codes | 815 and 779 |
| FIPS code | 17-47787 |
| GNIS feature ID | 2399282[1] |
| Wikimedia Commons | Mazon, Illinois |
| Website | villageofmazon |
Mazon (məˈzɒn/)[4] is a village in Mazon Township, Grundy County, Illinois, United States. The name derives from the Potawatomi word for "nettles"[5] (mzan).[6] The population was 979 at the 2020 census.[7] Illinois' State Fossil, the unique and bizarre Tully Monster was first found in nearby Mazon Creek.[8] Mazon was formerly served by the Santa Fe railway at the Mazon Depot. It was established in 1876.
Geography
[edit]According to the 2021 census gazetteer files, Mazon has a total area of 0.61 square miles (1.58 km2), of which 0.60 square miles (1.55 km2) (or 99.01%) is land and 0.01 square miles (0.03 km2) (or 0.99%) is water.[9]
Demographics
[edit]| Census | Pop. | Note | %± |
|---|---|---|---|
| 1900 | 447 | — | |
| 1910 | 471 | 5.4% | |
| 1920 | 442 | −6.2% | |
| 1930 | 526 | 19.0% | |
| 1940 | 512 | −2.7% | |
| 1950 | 586 | 14.5% | |
| 1960 | 683 | 16.6% | |
| 1970 | 727 | 6.4% | |
| 1980 | 828 | 13.9% | |
| 1990 | 764 | −7.7% | |
| 2000 | 904 | 18.3% | |
| 2010 | 1,015 | 12.3% | |
| 2020 | 979 | −3.5% | |
| U.S. Decennial Census[10] | |||
As of the 2020 census[7] there were 979 people, 477 households, and 332 families residing in the village. The population density was 1,610.20 inhabitants per square mile (621.70/km2). There were 401 housing units at an average density of 659.54 per square mile (254.65/km2). The racial makeup of the village was 92.54% White, 0.31% African American, 0.10% Native American, 0.10% Asian, 0.00% Pacific Islander, 1.53% from other races, and 5.41% from two or more races. Hispanic or Latino of any race were 5.21% of the population.
There were 477 households, out of which 26.8% had children under the age of 18 living with them, 58.70% were married couples living together, 2.31% had a female householder with no husband present, and 30.40% were non-families. 26.21% of all households were made up of individuals, and 13.42% had someone living alone who was 65 years of age or older. The average household size was 3.12 and the average family size was 2.56.
The village's age distribution consisted of 24.8% under the age of 18, 9.9% from 18 to 24, 26.3% from 25 to 44, 23.9% from 45 to 64, and 15.2% who were 65 years of age or older. The median age was 36.6 years. For every 100 females, there were 107.1 males. For every 100 females age 18 and over, there were 106.1 males.
The median income for a household in the village was $60,966, and the median income for a family was $73,875. Males had a median income of $60,685 versus $33,906 for females. The per capita income for the village was $32,776. About 2.4% of families and 4.7% of the population were below the poverty line, including 5.1% of those under age 18 and 3.2% of those age 65 or over.
Notes and references
[edit]- ^ a b c U.S. Geological Survey Geographic Names Information System: Mazon, Illinois
- ^ "Mayor & Village Council". Village of Mazon. Retrieved May 16, 2024.
- ^ "2020 U.S. Gazetteer Files". United States Census Bureau. Retrieved March 15, 2022.
- ^ Pronunciation Guide - Mazon (MP3 audio). University of Illinois.
- ^ GrundyILGW. "History of Mazon Illinois". Grundy County ILGenWeb. Retrieved August 5, 2022.
- ^ "Potawatomi Language Dictionary - View Word". potawatomidictionary.com. Retrieved August 5, 2022.
- ^ a b "Explore Census Data". data.census.gov. Retrieved June 28, 2022.
- ^ "ISM-Mazon Creek Fossil Exhibit".
- ^ "Gazetteer Files". Census.gov. United States Census Bureau. Retrieved June 29, 2022.
- ^ "Census of Population and Housing". Census.gov. Retrieved June 4, 2015.
 KSF
KSF