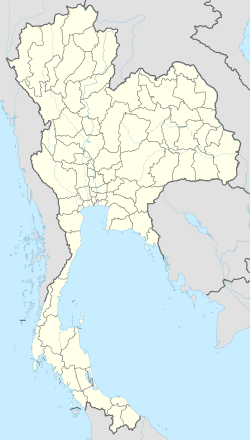
Ratchaburi
 From Wikipedia - Reading time: 7 min
Ratchaburi
ราชบุรี Rajburi, Rat Buri | |
|---|---|
Town | |
 View of Ratchaburi from Kaen Chan hill | |
| Coordinates: 13°32′8″N 99°48′48″E / 13.53556°N 99.81333°E[1] | |
| Country | Thailand |
| Province | Ratchaburi Province |
| District | Mueang Ratchaburi District |
| Subdistrict | Na Mueang |
| Area | |
• Total | 5,196 km2 (2,006 sq mi) |
| Population (2017)[3] | |
• Total | 36,169 |
| • Density | 7.0/km2 (18/sq mi) |
| Time zone | UTC+7 (ICT) |
Ratchaburi (Thai: ราชบุรี, pronounced [râːt.t͡ɕʰā.bū.rīː]) or Rajburi, Rat Buri) is a town (thesaban mueang) in western Thailand, capital of Ratchaburi Province.
Ratchaburi town covers the entire tambon Na Mueang (หน้าเมือง) of Mueang Ratchaburi District.[4] As of 2017 it had an estimated population of 36,169, down from 38,149 in 2005.[3]
History
[edit]The earliest evidence of settled habitation is that of the Dvaravati culture.[5] At one time it was thought that the early town was founded on the coast of the Gulf of Thailand, and that over time the coast had moved 30 km (18 miles) away to the south, due to sedimentation coming down the Mae Klong River.[6] However, geological and palynological investigation has shown that these early Dvaravati and proto-Dvaravati towns were all inland, at the edges of swamps when founded.[7] Ratchaburi remains an important commercial centre, however. Archeological discoveries show that the area was already settled in the Bronze Age, and the town itself is known to have existed for at least two thousand years.
In the 13th-century, King Ram Khamhaeng seized Ratchaburi and incorporated it into the Sukhothai Kingdom.[8] Later it was an important trade centre in the Ayutthaya Kingdom.[9] In 1768 the Burmese (who had recently destroyed Ayutthaya) were thrown out of Ratchaburi by King Taksin, and the town became part of Siam.[10]
In 2000, a splinter group of Karen activists from Burma, known as God's Army, briefly took the Ratchaburi hospital staff and patients hostage, before the siege was ended by the Thai army.[11][12][13]
Climate
[edit]| Climate data for Ratchaburi (1993–2022) | |||||||||||||
|---|---|---|---|---|---|---|---|---|---|---|---|---|---|
| Month | Jan | Feb | Mar | Apr | May | Jun | Jul | Aug | Sep | Oct | Nov | Dec | Year |
| Mean daily maximum °C (°F) | 31.9 (89.4) |
33.9 (93.0) |
35.4 (95.7) |
36.2 (97.2) |
35.1 (95.2) |
34.0 (93.2) |
33.3 (91.9) |
33.2 (91.8) |
32.9 (91.2) |
31.8 (89.2) |
31.4 (88.5) |
30.8 (87.4) |
33.3 (92.0) |
| Daily mean °C (°F) | 25.5 (77.9) |
27.2 (81.0) |
28.8 (83.8) |
29.7 (85.5) |
29.2 (84.6) |
28.6 (83.5) |
28.1 (82.6) |
28.1 (82.6) |
27.8 (82.0) |
27.2 (81.0) |
26.6 (79.9) |
25.3 (77.5) |
27.7 (81.8) |
| Mean daily minimum °C (°F) | 20.6 (69.1) |
22.1 (71.8) |
23.9 (75.0) |
25.1 (77.2) |
25.7 (78.3) |
25.4 (77.7) |
25.0 (77.0) |
25.0 (77.0) |
24.9 (76.8) |
24.6 (76.3) |
23.4 (74.1) |
21.2 (70.2) |
23.9 (75.0) |
| Average precipitation mm (inches) | 5.2 (0.20) |
7.1 (0.28) |
32.1 (1.26) |
44.0 (1.73) |
150.6 (5.93) |
130.7 (5.15) |
128.1 (5.04) |
118.0 (4.65) |
220.2 (8.67) |
235.0 (9.25) |
61.7 (2.43) |
10.4 (0.41) |
1,143.1 (45) |
| Average relative humidity (%) | 72 | 73 | 74 | 74 | 79 | 80 | 81 | 81 | 83 | 86 | 81 | 74 | 78 |
| Source: Soil Resources Survey and Research Division[14] | |||||||||||||
References
[edit]- ^ GoogleEarth
- ^ ตำบลหน้าเมือง อำเภอเมือง ราชบุรี [Tumbol Naimueang Amphoe Mueang Ratchaburi] (in Thai). ThaiTambon. Archived from the original on 16 June 2017.
- ^ a b "Thailand: Regions and Major Cities". Germany: City Population.
- ^ Thaitambon.com, Accessed 11 May 2011 (in Thai)[Link to precise page]
- ^ Higham, Charles (2014). Early Mainland Southeast Asia: From first humans to Angkor. Bangkok: River Books. ISBN 978-974-7381-34-4.
- ^ For a discussion of these sources, see Vickery, Michael (2000). "Coedès' Histories of Cambodia" (PDF). Silpakorn University International Journal. 1 (1): 61–108, page 70, note 19.
- ^ In general for siltation by the Mae Klong, see Melis, Romana; Violanti, Donata (2006). "Foraminiferal biodiversity and Holocene evolution of the Phetchaburi coastal area (Thailand Gulf)". Marine Micropaleontology. 61 (1/3): 94–115. Bibcode:2006MarMP..61...94M. doi:10.1016/j.marmicro.2006.05.006.
- ^ Gstaltmayr, Heiner F.; et al. (2015). "Ratchaburi". Baedeker Reiseführer Thailand (in German). Ostfildern: Baedeker (Mair Dumont). p. 480. ISBN 978-3-8297-9375-9.
- ^ Baker, Christopher John; Phongphaičhit, Phāsuk (2017). A History of Ayutthaya: Siam in the Early Modern World. Cambridge, England: Cambridge University Press. p. 186. ISBN 978-1-107-19076-4.
- ^ Baker & Phongphaičhit 2017, p. 263
- ^ Mishra, Omprakash; Ghosh, Sucheta (2003). Terrorism And Low Intensity Conflict In South Asian Region. New Delhi: Manak Publications. p. 361. ISBN 978-81-7827-073-9.
- ^ Richburg, Keith B. (24 January 2000). "Child Terrorists Hold Hundreds Hostage in Thailand". The Washington Post.
- ^ Horn, Robert; et al. (7 February 2000). "The Twin Terrors". Time. Retrieved 8 July 2018.
- ^ "การประเมินสถานภาพทรัพยากรดินในพื้นที่เกษตอัตลักษณ์พื้นถิ่น" (PDF). Land Development Department. Archived from the original (PDF) on 19 March 2024. Retrieved 20 March 2024.
External links
[edit] Media related to Ratchaburi at Wikimedia Commons
 Ratchaburi travel guide from Wikivoyage
- City of Ratchaburi (in Thai)
 KSF
KSF