Categories
Rolette County, North Dakota
 From Wikipedia - Reading time: 12 min
Rolette County | |
|---|---|
 | |
 Logo | |
 Location within the U.S. state of North Dakota | |
 North Dakota's location within the U.S. | |
| Coordinates: 48°46′06″N 99°50′26″W / 48.768271°N 99.840463°W | |
| Country | |
| State | |
| Founded | January 4, 1873 (created) October 14, 1884 (organized) |
| Named after | Joseph Rolette |
| Seat | Rolla |
| Largest community | Belcourt |
| Area | |
• Total | 939.499 sq mi (2,433.29 km2) |
| • Land | 903.042 sq mi (2,338.87 km2) |
| • Water | 36.457 sq mi (94.42 km2) 3.88% |
| Population (2020) | |
• Total | 12,187 |
• Estimate (2024) | 11,692 |
| • Density | 12.947/sq mi (4.999/km2) |
| Time zone | UTC−6 (Central) |
| • Summer (DST) | UTC−5 (CDT) |
| Congressional district | At-large |
| Website | rolettecounty.com |
Rolette County is a county in the U.S. state of North Dakota. As of the 2020 census, the population was 12,187,[1] and was estimated to be 11,692 in 2024.[2] The county seat is Rolla and the largest community is Belcourt.[3] The County has been known to have approximately several lakes in the County, they're mostly north-west of the county and some are in the north, also North of Dunseith, and north-west of Rolla. Some of the international peace garden is located along the north-west of the county, and about 14 miles (22 km) North of the city of Dunseith among the highway US-281 and ND-3.
History
[edit]The Dakota Territory legislature created the county on January 4, 1873, with territory partitioned from Buffalo County. It was not organized at that date, and was not attached to another county for judicial or administrative purposes. It was named for Joseph Rolette Jr., a fur trader and political figure from Pembina. The county government was effected on October 14, 1884, with Dunseith as the county seat. In 1885 the county seat was assigned to Saint John, and in 1889 it was assigned to Rolla.
The county boundaries were adjusted in 1883 and in 1887. It has retained its present boundary configuration since 1887.[4][5]
The International Peace Garden is located in the northwest corner of the county along the Canada–United States border with Manitoba.
Geography
[edit]
Rolette County lies on the northern border of North Dakota with Canada. Gimby Creek and Wakopa Creek flow into the county from Canada. The terrain consists of dry rolling hills in the south, and more verdant low hills in the north and northwest, dotted with lakes and ponds.[6]
Part of the Turtle Mountain plateau lies in the northwestern part of the county. The terrain slopes to the south and east; its highest point is its northwest corner, at 2,195 ft (669 m) ASL.[7]
The Turtle Mountain Indian Reservation is in the northeast section of Rolette County.
According to the United States Census Bureau, the county has a total area of 939.499 square miles (2,433.29 km2), of which 903.042 square miles (2,338.87 km2) is land and 36.457 square miles (94.42 km2) (3.88%) is water.[8] It is the 44th largest county in North Dakota by total area.[9]
Major highways
[edit]Adjacent counties and rural municipalities
[edit]- Municipality of Boissevain-Morton, Manitoba – northwest
- Municipality of Killarney-Turtle Mountain, Manitoba – northeast
- Towner County – east
- Pierce County – south
- Bottineau County – west
Protected areas
[edit]Lakes
[edit]- Belcourt Lake
- Bigham Lake
- Bymes Lake
- Carpenters Lake
- Coon Lake
- Gatten Lake
- Girl Lake
- Gordon Lake
- Hartley Lake (part)
- Horseshoe Lake
- Island Lake
- Lagerquist Lake
- Lake Upsilon
- Little Gurr Lake
- Long Lake
- Lords Lake (part)
- Mill Lake
- Mill Lake
- Rabb Lake
- School Section Lake
- Schutte Lake
- South Messier Lake (part)
- Ducker Lake
- Twin Lake
- Twin Lakes (part)
- Willow Lake[6]
Demographics
[edit]| Census | Pop. | Note | %± |
|---|---|---|---|
| 1890 | 2,427 | — | |
| 1900 | 7,995 | 229.4% | |
| 1910 | 9,558 | 19.5% | |
| 1920 | 10,061 | 5.3% | |
| 1930 | 10,760 | 6.9% | |
| 1940 | 12,583 | 16.9% | |
| 1950 | 11,102 | −11.8% | |
| 1960 | 10,641 | −4.2% | |
| 1970 | 11,549 | 8.5% | |
| 1980 | 12,177 | 5.4% | |
| 1990 | 12,772 | 4.9% | |
| 2000 | 13,674 | 7.1% | |
| 2010 | 13,937 | 1.9% | |
| 2020 | 12,187 | −12.6% | |
| 2024 (est.) | 11,692 | [10] | −4.1% |
| U.S. Decennial Census[11] 1790–1960[12] 1900–1990[13] 1990–2000[14] 2010–2020[2] | |||
As of the fourth quarter of 2024, the median home value in Rolette County was $98,539.[15]
As of the 2023 American Community Survey, there are 3,686 estimated households in Rolette County with an average of 3.23 persons per household. The county has a median household income of $57,355. Approximately 23.5% of the county's population lives at or below the poverty line. Rolette County has an estimated 53.1% employment rate, with 16.6% of the population holding a bachelor's degree or higher and 83.9% holding a high school diploma.[2]
The top five reported ancestries (people were allowed to report up to two ancestries, thus the figures will generally add to more than 100%) were English (93.0%), Spanish (0.9%), Indo-European (0.9%), Asian and Pacific Islander (0.6%), and Other (4.5%).
The median age in the county was 32.1 years.
Rolette County, North Dakota – racial and ethnic composition
Note: the US Census treats Hispanic/Latino as an ethnic category. This table excludes Latinos from the racial categories and assigns them to a separate category. Hispanics/Latinos may be of any race.
| Race / ethnicity (NH = non-Hispanic) | Pop. 1980[16] | Pop. 1990[17] | Pop. 2000[18] | Pop. 2010[19] | Pop. 2020[20] |
|---|---|---|---|---|---|
| White alone (NH) | 5,091 (41.81%) |
4,204 (32.92%) |
3,416 (24.98%) |
2,802 (20.10%) |
2,298 (18.86%) |
| Black or African American alone (NH) | 8 (0.07%) |
28 (0.22%) |
10 (0.07%) |
21 (0.15%) |
13 (0.11%) |
| Native American or Alaska Native alone (NH) | 7,020 (57.65%) |
8,457 (66.22%) |
9,907 (72.45%) |
10,677 (76.61%) |
9,210 (75.57%) |
| Asian alone (NH) | 18 (0.15%) |
13 (0.10%) |
10 (0.07%) |
16 (0.11%) |
23 (0.19%) |
| Pacific Islander alone (NH) | — | — | 0 (0.00%) |
1 (0.01%) |
8 (0.07%) |
| Other race alone (NH) | 3 (0.02%) |
5 (0.04%) |
4 (0.03%) |
1 (0.01%) |
8 (0.07%) |
| Mixed race or multiracial (NH) | — | — | 217 (1.59%) |
286 (2.05%) |
490 (4.02%) |
| Hispanic or Latino (any race) | 37 (0.30%) |
65 (0.51%) |
110 (0.80%) |
133 (0.95%) |
137 (1.12%) |
| Total | 12,177 (100.00%) |
12,772 (100.00%) |
13,674 (100.00%) |
13,937 (100.00%) |
12,187 (100.00%) |
2024 estimate
[edit]As of the 2024 estimate, there were 11,692 people and 3,686 households residing in the county. There were 4,596 housing units at an average density of 5.09 per square mile (2.0/km2). The racial makeup of the county was 18.5% White (18.2% NH White), 0.5% African American, 77.4% Native American, 0.3% Asian, 0.0% Pacific Islander, _% from some other races and 3.2% from two or more races. Hispanic or Latino people of any race were 1.3% of the population.[21]
2020 census
[edit]As of the 2020 census, there were 12,187 people, 4,114 households, and 2,857 families residing in the county.[22] The population density was 13.5 inhabitants per square mile (5.2/km2). There were 4,581 housing units at an average density of 5.07 per square mile (2.0/km2). The racial makeup of the county was 19.03% White, 0.14% African American, 76.13% Native American, 0.21% Asian, 0.07% Pacific Islander, 0.14% from some other races and 4.29% from two or more races. Hispanic or Latino people of any race were 1.12% of the population.[23] The most reported ancestries were:[24]
- Turtle Mountain Band of Chippewa Indians (56.3%)
- Chippewa (15.1%)
- German (7.1%)
- Norwegian (5.6%)
- French (3.2%)
- English (2.7%)
- Irish (2.4%)
- Finnish (1%)
- Mexican (1%)
2010 census
[edit]As of the 2010 census, there were 13,937 people, 4,783 households, and 3,413 families residing in the county. The population density was 15.4 inhabitants per square mile (5.9/km2). There were 5,372 housing units at an average density of 5.95 per square mile (2.3/km2). The racial makeup of the county was 20.27% White, 0.15% African American, 77.23% Native American, 0.11% Asian, 0.01% Pacific Islander, 0.11% from some other races and 2.12% from two or more races. Hispanic or Latino people of any race were 0.95% of the population.
In terms of ancestry, 48.5% were French Canadian, 7.0% were German, 6.8% were Norwegian, and 0.3% were American.
There were 4,783 households, 44.9% had children under the age of 18 living with them, 39.1% were married couples living together, 23.2% had a female householder with no husband present, 28.6% were non-families, and 25.0% of all households were made up of individuals. The average household size was 2.89 and the average family size was 3.39. The median age was 30.5 years.
The median income for a household in the county was $28,265 and the median income for a family was $35,523. Males had a median income of $35,595 versus $27,459 for females. The per capita income for the county was $13,632. About 25.9% of families and 31.8% of the population were below the poverty line, including 41.5% of those under age 18 and 24.8% of those age 65 or over.
Population by decade
[edit]
Communities
[edit]Cities
[edit]Census-designated places
[edit]Unincorporated communities
[edit]Townships
[edit]- Kohlmeier
- Maryville
- Shell Valley
- South Valley
- Holmes
Politics
[edit]Due to its Native American majority population, Rolette County voters are historically Democratic, and it is one of the most consistently Democratic counties in North Dakota. Since 1928 the only Republican to carry the county was Dwight D. Eisenhower in 1952.[25] It was the only county in the state to support George McGovern in 1972 and is additionally the only North Dakota county to have supported Jimmy Carter in 1980.[26] In each of the five presidential elections from 1996 to 2012, the Democratic candidate received over 60% of the vote, with Barack Obama winning 75.1% in 2008 and 74.0% in 2012.[27][28] In 2016, Democratic candidate Hillary Clinton received 55.9% of the county's votes,[29] one of the two North Dakota counties that she carried.
| Year | Republican | Democratic | Third party(ies) | |||
|---|---|---|---|---|---|---|
| No. | % | No. | % | No. | % | |
| 2024 | 1,427 | 35.02% | 2,567 | 62.99% | 81 | 1.99% |
| 2020 | 1,257 | 33.04% | 2,482 | 65.25% | 65 | 1.71% |
| 2016 | 1,217 | 32.41% | 2,099 | 55.90% | 439 | 11.69% |
| 2012 | 1,092 | 23.99% | 3,353 | 73.66% | 107 | 2.35% |
| 2008 | 1,045 | 23.05% | 3,403 | 75.06% | 86 | 1.90% |
| 2004 | 1,392 | 34.42% | 2,564 | 63.40% | 88 | 2.18% |
| 2000 | 1,416 | 32.20% | 2,681 | 60.96% | 301 | 6.84% |
| 1996 | 823 | 22.85% | 2,299 | 63.84% | 479 | 13.30% |
| 1992 | 895 | 24.82% | 2,002 | 55.52% | 709 | 19.66% |
| 1988 | 1,126 | 31.23% | 2,426 | 67.28% | 54 | 1.50% |
| 1984 | 1,479 | 39.43% | 2,179 | 58.09% | 93 | 2.48% |
| 1980 | 1,599 | 44.84% | 1,660 | 46.55% | 307 | 8.61% |
| 1976 | 1,094 | 29.62% | 2,531 | 68.54% | 68 | 1.84% |
| 1972 | 1,713 | 48.13% | 1,803 | 50.66% | 43 | 1.21% |
| 1968 | 1,211 | 37.23% | 1,870 | 57.49% | 172 | 5.29% |
| 1964 | 892 | 25.80% | 2,566 | 74.20% | 0 | 0.00% |
| 1960 | 1,277 | 35.33% | 2,335 | 64.59% | 3 | 0.08% |
| 1956 | 1,444 | 45.44% | 1,728 | 54.37% | 6 | 0.19% |
| 1952 | 2,188 | 65.02% | 1,160 | 34.47% | 17 | 0.51% |
| 1948 | 1,179 | 41.09% | 1,565 | 54.55% | 125 | 4.36% |
| 1944 | 1,070 | 37.78% | 1,745 | 61.62% | 17 | 0.60% |
| 1940 | 1,555 | 35.41% | 2,820 | 64.21% | 17 | 0.39% |
| 1936 | 857 | 19.34% | 3,186 | 71.89% | 389 | 8.78% |
| 1932 | 706 | 19.59% | 2,855 | 79.22% | 43 | 1.19% |
| 1928 | 1,327 | 37.50% | 2,181 | 61.63% | 31 | 0.88% |
| 1924 | 869 | 35.92% | 137 | 5.66% | 1,413 | 58.41% |
| 1920 | 2,139 | 75.05% | 535 | 18.77% | 176 | 6.18% |
| 1916 | 600 | 40.00% | 762 | 50.80% | 138 | 9.20% |
| 1912 | 339 | 26.74% | 396 | 31.23% | 533 | 42.03% |
| 1908 | 811 | 55.32% | 529 | 36.08% | 126 | 8.59% |
| 1904 | 912 | 66.38% | 366 | 26.64% | 96 | 6.99% |
| 1900 | 566 | 60.41% | 355 | 37.89% | 16 | 1.71% |
Education
[edit]School districts include:[32]
- Belcourt Public School District 7 (as the Turtle Mountain Community School, in cooperation with the Bureau of Indian Education (BIE))
- Bottineau Public School District 1
- Dunseith Public School District 1
- Mount Pleasant Public School District 4
- North Star School District 10
- Rolette Public School District 29
- Rugby Public School District 5
- St. John Public School District 3
Former districts:
- Wolford Public School District 1[32] - Closed in 2019[33]
See also
[edit]References
[edit]- ^ "Explore Census Data". United States Census Bureau. Retrieved March 29, 2025.
- ^ a b c "U.S. Census Bureau QuickFacts: Rolette County, North Dakota". www.census.gov. Retrieved March 29, 2025.
- ^ "Find a County". National Association of Counties. Retrieved March 29, 2025.
- ^ "Dakota Territory, South Dakota, and North Dakota: Individual County Chronologies". publications.newberry.org. The Newberry Library. 2006. Retrieved March 29, 2025.
- ^ "County History". www.nd.gov. State of North Dakota. Retrieved March 29, 2025.
- ^ a b "Rolette County, North Dakota". Google Maps. Retrieved April 27, 2024.
- ^ ""Find an Altitude/Rolette County ND" Google Maps (accessed February 24, 2019)". Archived from the original on May 21, 2019. Retrieved February 24, 2019.
- ^ "2024 County Gazetteer Files – North Dakota". United States Census Bureau. Retrieved March 29, 2025.
- ^ "U.S. Census Bureau QuickFacts: Rolette County, North Dakota". www.census.gov. Retrieved June 28, 2025.
- ^ "County Population Totals and Components of Change: 2020-2024". Retrieved March 29, 2025.
- ^ "U.S. Decennial Census". United States Census Bureau. Retrieved July 20, 2014.
- ^ "Historical Census Browser". University of Virginia Library. 2007. Archived from the original on December 12, 2009. Retrieved July 20, 2014.
- ^ Forstall, Richard L. (April 20, 1995). "Population of Counties by Decennial Census: 1900 to 1990". United States Census Bureau. Archived from the original on February 19, 1999. Retrieved July 20, 2014.
- ^ "Census 2000 PHC-T-4. Ranking Tables for Counties: 1990 and 2000" (PDF). United States Census Bureau. Archived (PDF) from the original on March 27, 2010. Retrieved July 20, 2014.
- ^ "County Median Home Price". National Association of Realtors. Retrieved June 28, 2025.
- ^ "Rolette County, North Dakota — Population by Race". CensusScope. Retrieved March 29, 2025.
- ^ "1990 Census of Population: General Population Characteristics North Dakota" (PDF). www.census.gov. October 6, 2022. p. 20. Retrieved June 28, 2025.
- ^ "P004: Hispanic or Latino, and Not Hispanic or Latino by Race – 2000: DEC Summary File 1 – Rolette County, North Dakota". United States Census Bureau. Retrieved March 29, 2025.
- ^ "P2: Hispanic or Latino, and Not Hispanic or Latino by Race – 2010: DEC Redistricting Data (PL 94-171) – Rolette County, North Dakota". United States Census Bureau. Retrieved March 29, 2025.
- ^ "P2: Hispanic or Latino, and Not Hispanic or Latino by Race – 2020: DEC Redistricting Data (PL 94-171) – Rolette County, North Dakota". United States Census Bureau. Retrieved March 29, 2025.
- ^ "County Population by Characteristics: 2020-2023". www.census.gov. United States Census Bureau. Retrieved June 28, 2025.
- ^ "US Census Bureau, Table P16: Household Type". United States Census Bureau. Retrieved March 29, 2025.
- ^ "How many people live in Rolette County, North Dakota". USA Today. Retrieved March 29, 2025.
- ^ "Detailed Races and Ethnicities in the United States and Puerto Rico: 2020 Census". census.gov. U.S. Census Bureau.
- ^ Geographie Electorale
- ^ David Leip's Presidential Atlas (Maps for North Dakota by election)
- ^ The New York Times electoral map (Zoom in on North Dakota)
- ^ 2012 presidential election results from North Dakota, New York Times. Retrieved December 27, 2016.
- ^ 2016 presidential election results from North Dakota, New York Times (December 20, 2016). Retrieved December 27, 2016.
- ^ Leip, David. "Atlas of US Presidential Elections". uselectionatlas.org. Retrieved November 10, 2024.
- ^ The leading "other" candidate, Progressive Theodore Roosevelt, received 322 votes, while Socialist Eugene Debs received 184 votes, Prohibition candidate Eugene Chafin received 27 votes.
- ^ a b 2020 Census - School District Reference Map: Rolette County, ND (PDF) (Map). United States Census Bureau. January 15, 2021. Retrieved June 28, 2025. - Text list - The map shows Wolford district's boundaries even though it was disestablished in 2019.
- ^ "Enrollment History Public School Districts 2009-2021". North Dakota Department of Public Instruction. Retrieved August 19, 2021. - Check the 2019-2020 spreadsheet, which does not list Wolford, while previous years do.
External links
[edit]- Rolette County – official website
- Rolette County map, North Dakota DOT
Places adjacent to Rolette County, North Dakota | ||||||||||||||||
|---|---|---|---|---|---|---|---|---|---|---|---|---|---|---|---|---|
| ||||||||||||||||
Municipalities and communities of Rolette County, North Dakota, United States | ||
|---|---|---|
| Cities | 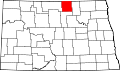 | |
| Townships | ||
| Unorganized territories | ||
| CDPs | ||
| Other communities | ||
| Indian reservation | ||
| Footnotes | ‡This populated place also has portions in an adjacent county or counties | |

| International | |
|---|---|
| National | |
| Other | |
 EncycloReader
is supported by the
EncycloReader
is supported by the