Categories
South Lakeland District Council elections
 From Wikipedia - Reading time: 7 min
One third of South Lakeland District Council in Cumbria, England was elected each year, followed by one year without election.
The council was established in 1974 and abolished in 2023.
Since the last boundary changes in 2008, 51 councillors had been elected from 45 wards.[1]
Political control
[edit]Since the first election to the council in 1973 political control of the council has been held by the following parties:[2]
| Party in control | Years | |
|---|---|---|
| Independent | 1973–1979 | |
| No overall control | 1979–2006 | |
| Liberal Democrats | 2006–2023 | |
Leadership
[edit]The leaders of the council since 2001 have been:[3]
| Councillor | Party | From | To | |
|---|---|---|---|---|
| Colin Hodgson | Conservative | 12 Sep 2001 | 16 May 2006 | |
| Brendan Jameson | Liberal Democrats | 16 May 2006 | 19 Mar 2012 | |
| Peter Thornton | Liberal Democrats | 16 May 2012 | 18 May 2016 | |
| Giles Archibald | Liberal Democrats | 18 May 2016 | 19 May 2021 | |
| Jonathan Brook | Liberal Democrats | 19 May 2021 | 31 Mar 2023 | |
Council elections
[edit]- 1973 South Lakeland District Council election
- 1976 South Lakeland District Council election
- 1979 South Lakeland District Council election (New ward boundaries)[4]
- 1980 South Lakeland District Council election
- 1982 South Lakeland District Council election
- 1983 South Lakeland District Council election
- 1984 South Lakeland District Council election
- 1986 South Lakeland District Council election
- 1987 South Lakeland District Council election
- 1988 South Lakeland District Council election
- 1990 South Lakeland District Council election (District boundary changes took place but the number of seats remained the same)[5]
- 1991 South Lakeland District Council election
- 1992 South Lakeland District Council election
- 1994 South Lakeland District Council election
- 1995 South Lakeland District Council election
- 1996 South Lakeland District Council election
- 1998 South Lakeland District Council election
- 1999 South Lakeland District Council election (New ward boundaries)[6][7]
- 2000 South Lakeland District Council election
- 2002 South Lakeland District Council election
- 2003 South Lakeland District Council election
- 2004 South Lakeland District Council election
- 2006 South Lakeland District Council election
- 2007 South Lakeland District Council election
- 2008 South Lakeland District Council election (New ward boundaries reduced the number of seats by 1)[2][8]
- 2010 South Lakeland District Council election
- 2011 South Lakeland District Council election
- 2012 South Lakeland District Council election
- 2014 South Lakeland District Council election
- 2015 South Lakeland District Council election
- 2016 South Lakeland District Council election
- 2018 South Lakeland District Council election (New ward boundaries)[9]
- 2019 South Lakeland District Council election
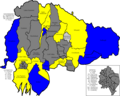
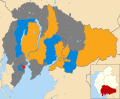
District result maps
[edit]-
 2006 results map
 -
 2007 results map
 -
 2008 results map
 -
 2010 results map
 -
 2011 results map
 -
 2012 results map
 -
 2014 results map
 -
 2015 results map
 -
 2016 results map
 -
 2018 results map
 -
 2019 results map


By-election results
[edit]1997-2001
[edit]| Party | Candidate | Votes | % | ±% | |
|---|---|---|---|---|---|
| Liberal Democrats | 219 | 55.7 | |||
| Conservative | 174 | 44.3 | |||
| Majority | 45 | 11.4 | |||
| Turnout | 393 | 37.1 | |||
| Liberal Democrats hold | Swing | ||||
2001-2005
[edit]| Party | Candidate | Votes | % | ±% | |
|---|---|---|---|---|---|
| Conservative | John Manning | 538 | 71.2 | N/A | |
| Liberal Democrats | Jonathan Woddy | 218 | 28.8 | N/A | |
| Majority | 320 | 42.4 | |||
| Turnout | 756 | 50.0 | |||
| Conservative gain from Independent | Swing | ||||
| Party | Candidate | Votes | % | ±% | |
|---|---|---|---|---|---|
| Conservative | William Tyson | 508 | 51.7 | +9.6 | |
| Liberal Democrats | Peter Metcalfe | 475 | 48.3 | −5.3 | |
| Majority | 33 | 3.4 | |||
| Turnout | 983 | ||||
| Conservative gain from Liberal Democrats | Swing | ||||
| Party | Candidate | Votes | % | ±% | |
|---|---|---|---|---|---|
| Liberal Democrats | Betty Spendlove | 423 | 57.0 | −8.9 | |
| Conservative | Walter Phillipson | 277 | 37.3 | +3.2 | |
| Labour | Susan Page | 42 | 5.7 | +5.7 | |
| Majority | 146 | 19.7 | |||
| Turnout | 742 | 50.1 | |||
| Liberal Democrats hold | Swing | ||||
| Party | Candidate | Votes | % | ±% | |
|---|---|---|---|---|---|
| Conservative | Brian Wilkinson | 202 | 62.9 | −3.4 | |
| Labour | Bharath Rajan | 94 | 29.3 | −4.4 | |
| Green | William Shaw | 25 | 7.8 | +7.8 | |
| Majority | 108 | 33.6 | |||
| Turnout | 321 | 23.3 | |||
| Conservative hold | Swing | ||||
2009-2015
[edit]| Party | Candidate | Votes | % | ±% | |
|---|---|---|---|---|---|
| Conservative | John Holmes | 474 | 49.5 | −5.4 | |
| Liberal Democrats | Jane Hall | 451 | 47.1 | +4.4 | |
| Labour | Marilyn Molloy | 32 | 3.3 | +1.0 | |
| Majority | 23 | 2.4 | |||
| Turnout | 957 | 48.73 | |||
| Conservative gain from Liberal Democrats | Swing | ||||
| Party | Candidate | Votes | % | ±% | |
|---|---|---|---|---|---|
| Liberal Democrats | Jo Stephenson | 418 | 72.9 | +3.0 | |
| Conservative | Sandra Lilley | 85 | 14.8 | −0.4 | |
| Labour | Penny Henderson | 50 | 8.7 | −6.1 | |
| UKIP | Robert Gibson | 20 | 3.5 | N/A | |
| Majority | 333 | 58.1 | |||
| Turnout | 573 | 33.63 | |||
| Liberal Democrats hold | Swing | ||||
| Party | Candidate | Votes | % | ±% | |
|---|---|---|---|---|---|
| Liberal Democrats | Colin Jones | 431 | 60.9 | −4.1 | |
| Conservative | Ian Keeling | 248 | 35.0 | +5.1 | |
| Labour | Rae Cross | 29 | 4.1 | −0.9 | |
| Majority | 183 | 25.9 | |||
| Turnout | 708 | 42.75 | |||
| Liberal Democrats hold | Swing | ||||
| Party | Candidate | Votes | % | ±% | |
|---|---|---|---|---|---|
| Liberal Democrats | Annie Rawlinson | 569 | 57.0 | +1.2 | |
| Conservative | Brian Rendell | 430 | 43.0 | +2.8 | |
| Majority | 139 | 14.0 | |||
| Turnout | 999 | 58.8 | |||
| Liberal Democrats hold | Swing | ||||
| Party | Candidate | Votes | % | ±% | |
|---|---|---|---|---|---|
| Liberal Democrats | Dyan Jones | 416 | 64.0 | −5.9 | |
| Conservative | Sandra Lilley | 184 | 28.3 | +13.1 | |
| Green | Gwen Harrison | 50 | 7.7 | N/A | |
| Majority | 333 | 58.1 | |||
| Turnout | 650 | 39.42 | |||
| Liberal Democrats hold | Swing | ||||
2015-2021
[edit]| Party | Candidate | Votes | % | ±% | |
|---|---|---|---|---|---|
| Liberal Democrats | Andrew Jarvis | 441 | 60.1 | +11.1 | |
| Conservative | Martin Hall | 256 | 34.9 | −4.1 | |
| Green | Kate Threadgold | 37 | 5.0 | −1.0 | |
| Majority | 185 | 25.2 | |||
| Turnout | 740 | 45.8 | |||
| Liberal Democrats hold | Swing | ||||
| Party | Candidate | Votes | % | ±% | |
|---|---|---|---|---|---|
| Liberal Democrats | Vicky Hughes | 695 | 50.9 | −13.4 | |
| Conservative | Tim Brown | 502 | 36.7 | +14.0 | |
| Labour | Alison Gilchrist | 87 | 6.4 | −0.1 | |
| Green | Chris Rowley | 82 | 6.0 | −0.4 | |
| Majority | 193 | 41.6 | |||
| Turnout | 1,372 | 46.76 | |||
| Liberal Democrats hold | Swing | ||||
| Party | Candidate | Votes | % | ±% | |
|---|---|---|---|---|---|
| Liberal Democrats | Helen Chaffey | 1,319 | 59.4 | +3.9 | |
| Conservative | Rachel Ashburner | 709 | 31.9 | −1.7 | |
| Green | Jill Abel | 125 | 5.6 | −7.4 | |
| Labour | Kate Love | 68 | 3.1 | −2.0 | |
| Majority | 610 | 27.5 | |||
| Turnout | 2,221 | 44.2 | |||
| Liberal Democrats hold | Swing | ||||
| Party | Candidate | Votes | % | ±% | |
|---|---|---|---|---|---|
| Liberal Democrats | Heather Troughton | 1,317 | 51.9 | +11.4 | |
| Conservative | Matt Brereton | 977 | 38.5 | +0.3 | |
| Green | Lynette Gilligan | 136 | 5.4 | −2.4 | |
| Labour | Paul Martin | 108 | 4.3 | −1.0 | |
| Majority | 340 | ||||
| Liberal Democrats gain from Conservative | Swing | ||||
| Party | Candidate | Votes | % | ±% | |
|---|---|---|---|---|---|
| Conservative | Ben Cooper | 939 | 45.7 | +9.3 | |
| Liberal Democrats | Loraine Birchall | 790 | 38.4 | −7.1 | |
| Labour | Sharon Webster | 216 | 10.5 | +0.2 | |
| Green | Peter Howlett | 111 | 5.4 | −2.5 | |
| Majority | 149 | ||||
| Conservative hold | Swing | ||||
| Party | Candidate | Votes | % | ±% | |
|---|---|---|---|---|---|
| Liberal Democrats | Pete Endsor | 1,427 | 60.2 | +2.5 | |
| Conservative | Aron Taylor | 627 | 26.4 | −1.7 | |
| Green | Robin Le Mare | 163 | 6.9 | −1.6 | |
| Labour | Ben Barker | 155 | 6.5 | +0.8 | |
| Majority | 800 | ||||
| Liberal Democrats hold | Swing | ||||
| Party | Candidate | Votes | % | ±% | |
|---|---|---|---|---|---|
| Liberal Democrats | Ali Jama | 1,206 | 52.1 | +1.6 | |
| Conservative | Luke Gudgeon | 794 | 34.3 | +2.3 | |
| Green | Frances Richardson | 239 | 10.3 | −3.3 | |
| Labour | Hanna Burke | 74 | 3.2 | −0.7 | |
| Majority | 412 | ||||
| Liberal Democrats hold | Swing | ||||
| Party | Candidate | Votes | % | ±% | |
|---|---|---|---|---|---|
| Liberal Democrats | Fiona Hanlon | 1,336 | 66.2 | +8.5 | |
| Conservative | Steve Chambers | 541 | 26.8 | −1.3 | |
| Green | Robin Le Mare | 85 | 4.2 | −4.3 | |
| Labour | Patricia Wright | 56 | 2.8 | −2.9 | |
| Majority | 800 | 33.8 | +4.2 | ||
| Turnout | 2,022 | 42.9 | −8.7 | ||
| Liberal Democrats hold | Swing | ||||
| Party | Candidate | Votes | % | ±% | |
|---|---|---|---|---|---|
| Liberal Democrats | Jonathan Cornthwaite | 622 | 46.9 | +12.2 | |
| Green | Liz Hendry | 527 | 39.8 | +9.9 | |
| Conservative | Aron Taylor | 122 | 9.2 | −14.6 | |
| Labour | Virginia Branney | 54 | 4.1 | −11.1 | |
| Majority | 95 | ||||
| Liberal Democrats hold | Swing | ||||
References
[edit]- ^ "About Elections". South Lakeland District Council. Retrieved 8 August 2011.
- ^ a b "South Lakeland". BBC News Online. 19 April 2008. Retrieved 17 March 2010.
- ^ "Council minutes". South Lakeland District Council. Retrieved 15 June 2022.
- ^ The District of South Lakeland (Electoral Arrangements) Order 1978
- ^ legislation.gov.uk - The Cumbria and Lancashire (County Boundaries) Order 1988. Retrieved on 5 November 2015.
- ^ "South Lakeland". BBC News Online. Retrieved 8 September 2009.
- ^ legislation.gov.uk - The District of South Lakeland (Electoral Changes) Order 1998. Retrieved on 4 October 2015.
- ^ legislation.gov.uk - The District of South Lakeland (Electoral Changes) Order 2008. Retrieved on 3 November 2015.
- ^ "The South Lakeland (Electoral Changes) Order 2017". legislation.gov.uk. 27 November 2017.
- ^ "Big gains for Labour in council byelections". guardian.co.uk. London. 12 October 2001. Retrieved 17 March 2010.
- ^ a b "No change after Salford battle". guardian.co.uk. London. 11 March 2005. Retrieved 8 September 2009.
- ^ "Election Results - 2010". South Lakeland District Council. Retrieved 8 August 2011.
External links
[edit]Licensed under CC BY-SA 3.0 | Source: https://en.wikipedia.org/wiki/South_Lakeland_District_Council_elections1 | ↧ Download as ZWI file
 EncycloReader
is supported by the
EncycloReader
is supported by the