Categories
Stafford Borough Council elections
 From Wikipedia - Reading time: 5 min
Stafford Borough Council elections are held every four years. Stafford Borough Council is the local authority for the non-metropolitan district of Stafford in Staffordshire, England. Since the last boundary changes in 2015, 40 councillors have been elected from 23 wards.[1]
Council elections
[edit]- 1973 Stafford Borough Council election
- 1976 Stafford Borough Council election
- 1979 Stafford Borough Council election (New ward boundaries)[2]
- 1983 Stafford Borough Council election
- 1987 Stafford Borough Council election
- 1991 Stafford Borough Council election
- 1995 Stafford Borough Council election (Borough boundary changes took place but the number of seats remained the same)[3]
- 1999 Stafford Borough Council election
- 2003 Stafford Borough Council election (New ward boundaries reduced the number of seats by one)[4][5]
- 2007 Stafford Borough Council election
- 2011 Stafford Borough Council election
- 2015 Stafford Borough Council election (New ward boundaries)[1]
- 2019 Stafford Borough Council election
- 2023 Stafford Borough Council election
Results maps
[edit]-
 2003 results map
 -
 2007 results map
 -
 2011 results map
 -
 2015 results map
 -
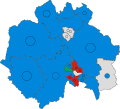 2019 results map
 -
 2023 results map


By-election results
[edit]1995-1999
[edit]| Party | Candidate | Votes | % | ±% | |
|---|---|---|---|---|---|
| Conservative | 832 | 52.4 | |||
| Labour | 537 | 33.8 | |||
| Liberal Democrats | 215 | 13.7 | |||
| Majority | 295 | 18.6 | |||
| Turnout | 1,584 | 31.0 | |||
| Conservative hold | Swing | ||||
1999-2003
[edit]| Party | Candidate | Votes | % | ±% | |
|---|---|---|---|---|---|
| Conservative | 892 | 67.9 | +0.4 | ||
| Labour | 269 | 20.5 | −11.9 | ||
| Liberal Democrats | 152 | 11.6 | +11.6 | ||
| Majority | 623 | 47.4 | |||
| Turnout | 1,313 | 25.5 | |||
| Conservative hold | Swing | ||||
| Party | Candidate | Votes | % | ±% | |
|---|---|---|---|---|---|
| Conservative | 661 | 66.3 | +4.0 | ||
| Liberal Democrats | 336 | 33.7 | −4.0 | ||
| Majority | 325 | 32.6 | |||
| Turnout | 997 | 21.0 | |||
| Conservative hold | Swing | ||||
| Party | Candidate | Votes | % | ±% | |
|---|---|---|---|---|---|
| Labour | 445 | 47.6 | −2.6 | ||
| Conservative | 368 | 39.4 | +10.4 | ||
| UKIP | 71 | 7.6 | +7.6 | ||
| Liberal Democrats | 50 | 5.4 | −9.4 | ||
| Majority | 78 | 8.2 | |||
| Turnout | 934 | 26.0 | |||
| Labour hold | Swing | ||||
| Party | Candidate | Votes | % | ±% | |
|---|---|---|---|---|---|
| Conservative | 336 | 77.1 | |||
| Liberal Democrats | 65 | 14.9 | |||
| Labour | 35 | 8.0 | |||
| Majority | 271 | 62.2 | |||
| Turnout | 436 | 27.1 | |||
| Conservative hold | Swing | ||||
| Party | Candidate | Votes | % | ±% | |
|---|---|---|---|---|---|
| Liberal Democrats | 310 | 49.8 | −8.8 | ||
| Labour | 220 | 35.3 | +7.4 | ||
| Conservative | 93 | 14.9 | +1.4 | ||
| Majority | 90 | 14.5 | |||
| Turnout | 623 | 32.2 | |||
| Liberal Democrats hold | Swing | ||||
2003-2007
[edit]| Party | Candidate | Votes | % | ±% | |
|---|---|---|---|---|---|
| Conservative | Geoffrey Collier | 368 | 38.5 | −2.3 | |
| Liberal Democrats | Peter Stevens | 313 | 32.8 | +7.8 | |
| Labour | Harry Brunt | 252 | 26.4 | −7.8 | |
| Independent | David Haswell | 22 | 2.3 | +2.3 | |
| Majority | 55 | 5.7 | |||
| Turnout | 955 | 27.7 | |||
| Conservative hold | Swing | ||||
| Party | Candidate | Votes | % | ±% | |
|---|---|---|---|---|---|
| Conservative | Peter Roycroft | unopposed | |||
| Conservative hold | Swing | ||||
2007-2011
[edit]| Party | Candidate | Votes | % | ±% | |
|---|---|---|---|---|---|
| Conservative | Roy Barron | 397 | 39.6 | −4.3 | |
| Labour | Alexandra Gribbon | 294 | 29.3 | −26.8 | |
| Liberal Democrats | Martin Shapland | 140 | 14.0 | +14.0 | |
| E.P.P. | Paul Gilbert | 78 | 7.8 | +7.8 | |
| Green | Damon Hoppe | 76 | 7.6 | +7.6 | |
| Majority | 103 | 10.3 | |||
| Turnout | 985 | 37.5 | |||
| Conservative hold | Swing | ||||
2011-2015
[edit]| Party | Candidate | Votes | % | ±% | |
|---|---|---|---|---|---|
| Independent | Jill Hood | 569 | |||
| Conservative | John O'Leary | 372 | |||
| Labour | Lloyd Brown | 306 | |||
| Independent gain from Conservative | Swing | ||||
| Party | Candidate | Votes | % | ±% | |
|---|---|---|---|---|---|
| Labour | Anne Denise Hobbs | 620 | |||
| Conservative | Violet Allan | 540 | |||
| Green | Kate Harding | 67 | |||
| UKIP | Malcolm Hurst | 61 | |||
| Labour gain from Conservative | Swing | ||||
| Party | Candidate | Votes | % | ±% | |
|---|---|---|---|---|---|
| Labour | Sharon Hollinshead | 448 | 64.1 | −6.3 | |
| Conservative | Jonathan Price | 251 | 35.9 | +6.3 | |
| Majority | 197 | 28.2 | |||
| Turnout | 699 | ||||
| Labour hold | Swing | ||||
2015-2019
[edit]| Party | Candidate | Votes | % | ±% | |
|---|---|---|---|---|---|
| Conservative | Victoria Jenkinson | 650 | |||
| Conservative | William Taylor | 620 | |||
| Labour | David Barron | 602 | |||
| Labour | Mike Winkle | 544 | |||
| Green | Toby Hollinshead | 109 | |||
| Green | Doug Rouxel | 97 | |||
| Conservative gain from Labour | Swing | ||||
| Conservative gain from Labour | Swing | ||||
References
[edit]- ^ a b "The Stafford (Electoral Changes) Order 2015", legislation.gov.uk, The National Archives, SI 2015/69, retrieved 16 September 2022
- ^ The Borough of Stafford (Electoral Arrangements) Order 1976 (S.I. 1976/753)
- ^ legislation.gov.uk - The Stafford and Staffordshire Moorlands (District Boundaries) Order 1992. Retrieved on 7 November 2015.
- ^ "Stafford". BBC News Online. Retrieved 13 August 2009.
- ^ "The Borough of Stafford (Electoral Changes) Order 2001", legislation.gov.uk, The National Archives, SI 2001/1447, retrieved 16 September 2022
- ^ "Common Ward: Declaration of result of poll" (PDF). Stafford Borough Council. Retrieved 13 August 2009.
- ^ "Local Elections Archive Project — Coton Ward". www.andrewteale.me.uk. Retrieved 17 July 2023.
- ^ "Local Elections Archive Project — Highfields and Western Downs Ward". www.andrewteale.me.uk. Retrieved 17 July 2023.
External links
[edit]Licensed under CC BY-SA 3.0 | Source: https://en.wikipedia.org/wiki/Stafford_Borough_Council_elections53 views | Status: cached on August 12 2025 09:01:33↧ Download as ZWI file
 EncycloReader
is supported by the
EncycloReader
is supported by the