Categories
Thurston County, Washington
 From Wikipedia - Reading time: 28 min
Thurston County | |
|---|---|
 Former Thurston County Courthouse in Summer 2025 | |
|
Logo | |
 Location within the U.S. state of Washington | |
 Washington's location within the U.S. | |
| Coordinates: 46°56′N 122°50′W / 46.93°N 122.83°W | |
| Country | |
| State | |
| Founded | January 12, 1852 |
| Named after | Samuel Thurston |
| Seat | Olympia |
| Largest city | Lacey |
| Area | |
• Total | 774 sq mi (2,000 km2) |
| • Land | 722 sq mi (1,870 km2) |
| • Water | 52 sq mi (130 km2) 6.7% |
| Population | |
• Total | 294,793 |
• Estimate (2024)[1] | 302,912 |
| • Density | 408/sq mi (158/km2) |
| Time zone | UTC−8 (Pacific) |
| • Summer (DST) | UTC−7 (PDT) |
| Congressional districts | 3rd, 10th |
| Website | www |
Thurston County is a county located in the U.S. state of Washington. As of the 2020 census, its population was 294,793.[1] The county seat is Olympia,[2] the state capital.
Thurston County was created out of Lewis County by the government of Oregon Territory on January 12, 1852. At that time, it covered all of the Puget Sound region and the Olympic Peninsula. On December 22 of the same year, Pierce, King, Island, and Jefferson counties were split off from Thurston County.[3][4] It is named after Samuel R. Thurston, the Oregon Territory's first delegate to Congress.[5] Today, the county includes the southernmost part of the South Puget Sound and areas south along the I-5 corridor.
Thurston County comprises the Olympia–Lacey–Tumwater, WA Metropolitan Statistical Area and is included in the Seattle–Tacoma, WA Combined Statistical Area.
History
[edit]The southern end of Puget Sound is the homeland of several indigenous Coast Salish groups, including the Nisqually, Squaxin, and Upper Chehalis.[6] Archeological remains at Tumwater Falls date back to 2,500 to 3,000 years before present; the area around the falls included a settlement with several longhouses. The first European exhibition to the southern Puget Sound was conducted by Peter Puget and Joseph Whidbey on the British-led Vancouver Expedition in May 1792. The Hudson's Bay Company established a trading post at Fort Nisqually in 1833 on the east side of the Nisqually Delta while the Oregon Country was under joint administration by the British and American governments.[7] Permanent European (and later American) settlement of modern-day Thurston County began with the arrival of a pioneer party led by Michael Simmons and Black pioneer George Bush in 1845. Several families settled near Tumwater Falls at a site they named "New Market", which became the first European settlement in Western Washington.[7]
The area north of the Columbia River was originally under the jurisdiction of the Vancouver District (later renamed Clark County) until 1845, when Lewis County was created from the area west of the Cowlitz River. The entire region was ceded to the United States with the signing of the Oregon Treaty in 1846 and organized into Oregon Territory two years later.[8] A petition by 54 residents of Olympia and surrounding communities was submitted to the Oregon Territorial Legislature in December 1851 to create a new county from Lewis County. The proposed name of Simmons County, named for Michael Simmons, was changed to Thurston County by the legislature at the suggestion of Asa Lovejoy to honor Samuel Thurston, the first delegate to the U.S. Congress from Oregon Territory.[8] Thurston himself had never visited the area.[9]
Thurston County was created on January 12, 1852, by the Oregon Territorial Legislature and Olympia was designated as its seat.[8] It included the entire Olympic Peninsula and Puget Sound region up to the northern border with British North America and went as far east as the Cascade Mountains.[7] On December 22, the northern areas of Thurston County were divided to form Island, Jefferson, King, and Pierce counties.[8] A portion of the county south of the Chehalis River was ceded to Lewis County in February 1853, a month before Washington Territory was created with its capital in Olympia.[7][10] Sawamish County (now Mason County) was created in March 1854 from the northwestern portions of Thurston County and Chehalis County (now Grays Harbor County) was established a month later from the remaining western half of Thurston County. Several exchanges of land between Thurston and neighboring counties were made during the 1860s and settled into the modern boundaries by 1873.[8][10] An attempt to move the county seat from Olympia to Tumwater or West Olympia was defeated by voters in 1861.[8]
Olympia was retained as capital of Washington after it was granted statehood in 1889; the city did not win a majority in the first referendum after Ellensburg and North Yakima, but defeated both in a second vote. Local residents built a branch line to connect with the Northern Pacific Railroad and approved a harbor-dredging operation to promote Olympia as a trade hub as the area fell behind Seattle and Tacoma in population growth.[7]

The 150-foot (46 m) Old Capitol Building was completed in 1892 and was purchased by the state government in 1901 for use to replace a temporary wooden structure built in 1856. The modern Washington State Capitol commenced construction in 1923 and was completed in 1928 alongside a campus of government buildings and monuments.[7][11] Thurston County remained predominantly dependent on the logging industry until the state government became the county's largest employment sector in the 1950s. Several state government agencies had attempted to move their offices to Seattle until a 1954 Washington Supreme Court ruling mandated that their headquarters remain in the Olympia area.[7]
The first section of Interstate 5 built in Thurston County was the 6.5-mile (10.5 km) Olympia Freeway, which opened in December 1958 to bypass the city's downtown. Other sections opened over the following decade, extending access through Lacey and Tumwater, where it destroyed portions of the historic downtown;[12] a proposal to build the freeway further away from Olympia was rejected to preserve rural areas.[13][14] The completion of Interstate 5 enabled the growth of bedroom communities around Thurston County, which saw its population rapidly increase from the 1950s to 1970s.[7][12] The first suburban shopping center in the county, the South Sound Center in Lacey, opened in October 1966; it was followed by Lacey's incorporation as a city. The Evergreen State College, a public liberal arts college in western Olympia, opened in 1972.[7]
Thurston County, like many of the other counties in Western Washington, has a racially restrictive past.[15] Racial segregation in Washington was different from the well-known accounts of Southern segregation during the Jim Crow era. While Southern states required racial segregation in public facilities by law, much of the racial segregation in Washington was accomplished through racial restrictive covenants which were legally binding agreements between private parties.[16] These covenants were often included in property deeds between individual buyers and sellers, who agreed to never sell the property to specified racial or religious groups. In some cases, large groups of property owners would come together to implement racial restrictive covenants on entire subdivisions or neighborhoods, which are called petitions.[17] In Thurston County specifically, many covenants excluded any Black, mixed race, Chinese, Japanese, or Indian individuals from purchasing, renting, leasing, or occupying specified properties.[18] In rarer cases, Italians and Jewish individuals were also excluded from homeownership. [18] The late 1930s to the early 1950s saw the largest number of racial restrictive covenants enacted.[18] This history of segregation has had generational effects that are still felt today as people of color were systematically denied the ability to purchase homes and in turn were denied the ability to accrue generational wealth that comes with owning a home.[19]
Geography
[edit]According to the United States Census Bureau, the county has a total area of 774 square miles (2,000 km2), of which 722 square miles (1,870 km2) is land and 52 square miles (130 km2) (6.7%) is water.[20]
Adjacent counties
[edit]- Pierce County – northeast
- Lewis County – south
- Grays Harbor County – west
- Mason County – north/northwest
Major highways
[edit]Geographic features
[edit]Major watersheds: Black River, Budd/Deschutes, Chehalis River, Eld Inlet, Henderson Inlet, Nisqually River, Skookumchuck River, Totten Inlet and West Capitol Forest.
- Alder Lake
- Bald Hill Lake
- Barnes Lake
- Bass Lake
- Bigelow Lake
- Black Lake
- Black River
- Budd Inlet
- Capitol Lake
- Capitol Peak
- Capitol State Forest
- Chambers Lake
- Chehalis River
- Clear Lake
- Deep Lake
- Deschutes River
- Elbow Lake
- Eld Inlet
- Fifteen Lake
- Gehrke Lake
- Grass Lake
- Henderson Inlet
- Hewitt Lake
- Hicks Lake
- Lake Lawrence
- Libby Creek
- Lois Lake
- Long Lake
- McIntosh Lake
- Mima Mounds
- Munn Lake
- Nisqually River
- Offut Lake
- Patterson Lake
- Puget Sound
- Reichel Lake
- Rocky Prairie
- Saint Clair Lake
- Scott Lake
- Simmons Lake
- Skookumchuck River
- Smith Lake
- Southwick Lake
- Springer Lake
- Summit Lake
- Susan Lake
- Totten Inlet
- Trails End Lake
- Trosper Lake
- Ward Lake
National protected areas
[edit]Ecology and environment
[edit]The habitat for the Golden Paintbrush (Castilleja levisecta) runs through the county. The plant was placed on the Endangered Species list in 1997 but due to conservation efforts the 12 in (30 cm) tall prairie flower was delisted in 2023.[21]
Wildlife and land preserves in South Thurston County include the Black River Habitat Management Area, the Glacial Heritage Preserve,[22] and the Scatter Creek Wildlife Area.
Economy
[edit]As of May 2025[update], Thurston County has 131,600 non-farm jobs and an unemployment rate of 4.1% without adjustments for seasonal labor.[23] The mean hourly wage in the county across all non-farm occupations was $35.18 in May 2024, which is above the national average of $32.66.[24]
As of December 2023[update], Thurston County had 143,640 employed individuals; the county's top employers were:[25]
| Rank | Employer | Employees in 2023 | Employees in 2014 | 2023 Share | 2014 Share |
|---|---|---|---|---|---|
| 1 | State Government, including Education | 23,896 | 20.42% | ||
| 2 | Local Government, including Education | 11,910 | 10.18% | ||
| 3 | Providence Health & Services | 1,600 | 1.37% | ||
| 4 | Albertsons/Safeway | 876 | 0.75% | ||
| 5 | Walmart | 1,023 | 0.87% | ||
| 6 | Lucky Eagle Casino | 600 | 0.51% | ||
| 7 | Federal Government | 862 | 0.74% | ||
| 8 | Nisqually Red Wind Casino | 600 | 0.51% | ||
| 9 | South Sound YMCA | - | 0% | ||
| 10 | Continuum Global Solutions | - | 0% | ||
| 10 | Fred Meyer | - | 0% | ||
| 10 | Great Wolf Lodge | - | 0% | ||
| 10 | Northwest Cannabis Solutions | - | 0% |
Demographics
[edit]| Census | Pop. | Note | %± |
|---|---|---|---|
| 1860 | 1,507 | — | |
| 1870 | 2,246 | 49.0% | |
| 1880 | 3,270 | 45.6% | |
| 1890 | 9,675 | 195.9% | |
| 1900 | 9,927 | 2.6% | |
| 1910 | 17,581 | 77.1% | |
| 1920 | 22,366 | 27.2% | |
| 1930 | 31,351 | 40.2% | |
| 1940 | 37,285 | 18.9% | |
| 1950 | 44,884 | 20.4% | |
| 1960 | 55,049 | 22.6% | |
| 1970 | 76,894 | 39.7% | |
| 1980 | 124,264 | 61.6% | |
| 1990 | 161,238 | 29.8% | |
| 2000 | 207,355 | 28.6% | |
| 2010 | 252,264 | 21.7% | |
| 2020 | 294,793 | 16.9% | |
| 2024 (est.) | 302,912 | [26] | 2.8% |
| U.S. Decennial Census[27] 1790–1960[28] 1900–1990[29] 1990–2000[30] 2010–2020[1] | |||
Thurston County has the sixth-largest population among Washington's counties and is among the fastest-growing in the state. From 2010 to 2020, the county's population became more ethnically diverse, with the number of residents who identify as Hispanic or Latino increasing by 63.2%.[31] The county's largest city is Lacey, which has an estimated population of over 60,000 and surpassed Olympia's population in the early 2020s.[32] The smallest incorporated place in Thurston County is the town of Bucoda, which has 620 residents. Over 145,000 people live in the unincorporated areas of the county, which are primarily concentrated between Olympia and Lacey.[33]
The entire county is designated as part of the Olympia–Lacey–Tumwater Metropolitan Statistical Area (MSA), which only includes Thurston County. The MSA was among the fastest-growing metropolitan areas in the U.S. in the 2010s, with a year-to-year population increase of 2.24 percent.[34] The county also had the highest population of middle class households among metropolitan areas in the U.S. according to a 2024 Pew Research study, which determined that 66 percent of households had adults with an annual income near double the national median household income.[35] Thurston County is also part of the Seattle–Tacoma, WA Combined Statistical Area, which includes most of the Puget Sound region.[36]
2020 census
[edit]As of the 2020 census, there were 294,793 people, 115,397 households, and 76,717 families living in the county.[37] The population density was 408.0 inhabitants per square mile (157.5/km2). There were 121,438 housing units at an average density of 168.1 inhabitants per square mile (64.9/km2). The racial makeup of the county was 73.2% White, 3.2% African American, 1.5% Native American, 5.9% Asian, 1.1% Pacific Islander, 3.5% from some other races and 11.6% from two or more races. Hispanic or Latino people of any race were 9.8% of the population.[38] 20.5% of residents were under the age of 18, 5.1% were under 5 years of age, and 19.3% were 65 and older.
2010 census
[edit]As of the 2010 census, there were 252,264 people, 100,650 households, and 66,161 families living in the county.[39] The population density was 349.4 inhabitants per square mile (134.9/km2). There were 108,182 housing units at an average density of 149.8 per square mile (57.8/km2).[40] The racial makeup of the county was 82.4% white, 5.2% Asian, 2.7% black or African American, 1.4% American Indian, 0.8% Pacific islander, 2.2% from other races, and 5.3% from two or more races. Those of Hispanic or Latino origin made up 7.1% of the population.[39] In terms of ancestry, 21.2% were German, 13.4% were English, 13.2% were Irish, 5.0% were Norwegian, and 4.7% were American.[41]
Of the 100,650 households, 31.7% had children under the age of 18 living with them, 49.9% were married couples living together, 11.4% had a female householder with no husband present, 34.3% were non-families, and 25.9% of all households were made up of individuals. The average household size was 2.46 and the average family size was 2.95. The median age was 38.5 years.[39]
The median income for a household in the county was $60,930 and the median income for a family was $71,833. Males had a median income of $53,679 versus $41,248 for females. The per capita income for the county was $29,707. About 7.1% of families and 10.3% of the population were below the poverty line, including 13.0% of those under age 18 and 5.9% of those age 65 or over.[42]
2000 census
[edit]As of the 2000 census, there were 207,355 people, 81,625 households and 54,933 families living in the county. The population density was 285 people per square mile (110 people/km2). There were 86,652 housing units at an average density of 119 units per square mile (46 units/km2). The racial makeup of the county was 85.66% White, 2.35% Black or African American, 1.52% Native American, 4.41% Asian, 0.52% Pacific Islander, 1.69% from other races, and 3.85% from two or more races. 4.53% of the population were Hispanic or Latino of any race. 17.1% were of German, 10.2% English, 9.8% Irish, 6.9% United States or American and 5.5% Norwegian ancestry.
There were 81,625 households, of which 33.00% had children under the age of 18 living with them, 53.10% were married couples living together, 10.30% had a female householder with no husband present, and 32.70% were non-families. 25.10% of all households were made up of individuals, and 8.00% had someone living alone who was 65 years of age or older. The average household size was 2.50 and the average family size was 2.99.
Age distribution was 25.30% under the age of 18, 9.30% from 18 to 24, 29.30% from 25 to 44, 24.60% from 45 to 64, and 11.40% who were 65 years of age or older. The median age was 36 years. For every 100 females, there were 96.00 males. For every 100 females age 18 and over, there were 92.70 males.
The median household income was $46,975, and the median family income was $55,027. Males had a median income of $40,521 versus $30,368 for females. The per capita income for the county was $22,415. About 5.80% of families and 8.80% of the population were below the poverty line, including 9.80% of those under age 18 and 5.00% of those age 65 or over.
Homelessness
[edit]Thurston County is a participant in the mandatory federal Point-In-Time Count, a census of the local homeless population that is conducted by community organizations and volunteers. As of January 2024[update], there were 952 people in the county who were counted and classified as homeless, an increase of over 200 from the prior year. Most of the people who were identified as unsheltered lived in vehicles and 79 percent were from Thurston County or an adjacent county. Based on the Point-In-Time Count, Thurston County had a sixth-highest rate of people experiencing homelessness per capita among Washington's counties.[43]
Government
[edit]Thurston County is governed by a five-member board of county commissioners who are elected to four-year terms from proportional districts. The board of commissioners was enlarged from three members to five members in November 2023 following the approval of a ballot measure to expand the board that passed a year prior.[44] The head of the Thurston County government's administration is the county manager, who is appointed by the board of commissioners. Since 2024, the county manager has been Leonard Hernandez, who was previously the CEO of San Bernardino County, California.[45] Thurston County has used its commissioner–manager form of government since it was formed in 1852.[46] An attempt to adopt a home rule charter with an elected county executive and seven-member county council was rejected by voters in 1979.[47]
The county is split between two U.S. congressional districts, which each elect a member to the United States House of Representatives: the 3rd district, generally south of State Route 507; and the 10th district, which includes the urban areas of Olympia, Lacey, and Tumwater, as well as Yelm.[48] Until the creation of the 10th district following the 2010 U.S. census, Olympia and Lacey were in separate congressional districts.[49] At the state level, Thurston County is part of five legislative districts that each elect a state senator and two state representatives. The 2nd district encompasses the rural southeast of the county; the 19th district includes Grand Mound and the southwest corner of the county; the 20th district includes an area east of Grand Mound; the 22nd district includes Olympia, Lacey, and Tumwater; and the 35th district encompasses western and central Thurston County.[48]
As of 2023[update], Thurston County had approx. 1,200 full-time employees and an annual budget of $132.2 million.[50]
Special districts
[edit]Special-purpose districts include cemetery, fire, hospital, library, school, and water and sewer districts. Each special district is governed by officials elected by voters within that jurisdiction.
Fire districts
[edit]Seven fire districts, three city fire departments, and two regional fire authorities provide fire prevention, fire fighting, and emergency medical services. Each fire district is governed by an elected board of commissioners. Most districts have three commissioners. Fire districts receive most of their revenue from property taxes. All of the fire districts and the regional fire authority have volunteer or paid-call firefighters and emergency medical technicians (EMTs).
The City of Olympia is an all-career department. Fire District 3 only allows volunteers to live within the City of Lacey city limits.
Thurston County Fire Districts are:[51]
- Fire District 1 merged with Fire District 14 in 2002, then merging with Fire District 11 in 2010 to form West Thurston Regional Fire Authority.
- Fire District 2 merged with Fire District 4 to form S.E. Thurston Fire Authority in 2010.
- Fire District 3 serves the City of Lacey and surrounding areas.
- Fire District 4 merged with Fire District 2 to form S.E. Thurston Fire Authority in 2010.
- Fire District 5 consolidated with Fire District 9, forming McLane – Black Lake Fire Department in 2008, fully merging in 2018.
- Fire District 6 serves East Olympia.
- Fire District 7 merged with Fire District 8 in 2015.
- Fire District 8 serves South Bay, Johnson Point, and North Olympia.
- Fire District 9 operates as McLane – Black Lake Fire Department.
- Fire District 10 merged with Fire District 9 in 1976.
- Fire District 11 merged into Fire District 1 in 2010 to form West Thurston Regional Fire Authority.
- Fire District 12 merged with Fire District 16 to form South Thurston Fire & EMS in 2017.
- Fire District 13 serves Steamboat Island, south to Route 8.
- Fire District 14 merged with Fire District 1 in 2002.
- Fire District 15 contracted service with the City of Tumwater on January 4, 1967, being annexed into the city of 2016.
- Fire District 16 merged into Fire District 12 to form South Thurston Fire & EMS in 2017.
- Fire District 17 serves Bald Hills.
Politics
[edit]Thurston County leans Democratic in both national and local elections. The county has voted for the Democratic presidential candidate since 1988 and the candidates have consistently received a majority of the vote in the county. Democrat Bob Ferguson defeated Republican Dave Reichert in the 2024 gubernatorial election in Thurston County by an 11.7 percent margin, 55.7 percent to 44.0 percent.[52] As of the 2024 election, all five Thurston County Commissioners are Democrats.[53]
| Year | Republican | Democratic | Third party(ies) | |||
|---|---|---|---|---|---|---|
| No. | % | No. | % | No. | % | |
| 2024 | 62,282 | 37.85% | 95,663 | 58.14% | 6,592 | 4.01% |
| 2020 | 65,277 | 38.82% | 96,608 | 57.46% | 6,249 | 3.72% |
| 2016 | 48,624 | 36.23% | 68,798 | 51.27% | 16,769 | 12.50% |
| 2012 | 49,287 | 38.58% | 74,037 | 57.96% | 4,416 | 3.46% |
| 2008 | 48,366 | 37.97% | 75,882 | 59.57% | 3,142 | 2.47% |
| 2004 | 47,992 | 42.55% | 62,650 | 55.55% | 2,147 | 1.90% |
| 2000 | 39,924 | 40.98% | 50,467 | 51.80% | 7,031 | 7.22% |
| 1996 | 29,835 | 34.18% | 45,522 | 52.16% | 11,923 | 13.66% |
| 1992 | 25,643 | 30.32% | 38,293 | 45.28% | 20,633 | 24.40% |
| 1988 | 31,980 | 47.78% | 33,860 | 50.59% | 1,090 | 1.63% |
| 1984 | 34,442 | 55.51% | 26,840 | 43.26% | 763 | 1.23% |
| 1980 | 26,369 | 48.10% | 20,508 | 37.41% | 7,946 | 14.49% |
| 1976 | 21,000 | 47.67% | 21,247 | 48.23% | 1,809 | 4.11% |
| 1972 | 22,297 | 57.48% | 14,596 | 37.63% | 1,899 | 4.90% |
| 1968 | 13,742 | 45.06% | 14,228 | 46.65% | 2,529 | 8.29% |
| 1964 | 9,351 | 34.61% | 17,578 | 65.05% | 92 | 0.34% |
| 1960 | 13,921 | 54.37% | 11,620 | 45.38% | 65 | 0.25% |
| 1956 | 14,093 | 58.70% | 9,897 | 41.22% | 19 | 0.08% |
| 1952 | 13,904 | 58.32% | 9,764 | 40.96% | 172 | 0.72% |
| 1948 | 9,511 | 45.72% | 10,461 | 50.28% | 832 | 4.00% |
| 1944 | 7,900 | 44.47% | 9,708 | 54.64% | 158 | 0.89% |
| 1940 | 7,275 | 39.17% | 11,092 | 59.72% | 206 | 1.11% |
| 1936 | 4,425 | 28.05% | 10,647 | 67.49% | 703 | 4.46% |
| 1932 | 4,241 | 30.91% | 6,308 | 45.97% | 3,173 | 23.12% |
| 1928 | 7,203 | 69.59% | 3,013 | 29.11% | 135 | 1.30% |
| 1924 | 5,125 | 57.77% | 943 | 10.63% | 2,803 | 31.60% |
| 1920 | 3,899 | 52.77% | 1,367 | 18.50% | 2,122 | 28.72% |
| 1916 | 3,223 | 47.76% | 2,658 | 39.39% | 867 | 12.85% |
| 1912 | 1,937 | 30.69% | 1,456 | 23.07% | 2,918 | 46.24% |
| 1908 | 1,940 | 57.28% | 964 | 28.46% | 483 | 14.26% |
| 1904 | 2,121 | 68.51% | 668 | 21.58% | 307 | 9.92% |
| 1900 | 1,298 | 54.56% | 978 | 41.11% | 103 | 4.33% |
| 1896 | 1,052 | 42.27% | 1,415 | 56.85% | 22 | 0.88% |
| 1892 | 1,043 | 41.70% | 810 | 32.39% | 648 | 25.91% |
Education
[edit]Several school districts provide K–12 education in Thurston County, including those that overlap with other counties:[56]
Thurston County also has three post-secondary educational institutions:
Parks and recreation
[edit]The county is home to several rail trails, including the Chehalis Western Trail, which is the longest in the county, the Karen Fraser Woodland Trail, and the Yelm-Rainier-Tenino Trail.
Culture
[edit]Arts and music
[edit]Olympia is a noted countercultural hub in the Pacific Northwest, particularly in music. It gained national prominence for its indie music in the late 20th century, and was home to various grunge, punk, and indie rock bands that achieved national recognition in the 1980s and 1990s, notably including Nirvana, Bikini Kill, and Sleater-Kinney. Indie label K Records and the Evergreen State College's radio station KAOS, both founded by musician Calvin Johnson, brought many groups into the mainstream and wider success.[57]
Media
[edit]The newspaper of record for Thurston County is The Olympian, a newspaper based in Olympia that is owned by the McClatchy Company and publishes three print editions per week.[58][59] As of 2022[update], it has a circulation of 17,401.[60] The Olympian was founded in 1891 and merged with several local newspapers in the early 20th century to become the sole daily newspaper in the county. Earlier newspapers included The Columbian, founded in 1852, and The Washington Standard, which was published weekly from 1860 to 1921.[61] As the state capital, Olympia formerly had bureaus for newspapers across the state, including the two dailies in Seattle, and several reporters from the Associated Press. By 2021, the Olympia bureaus had shrunk to only six reporters.[62]
The county also has several weekly and online news publications.[60] The Nisqually Valley News, founded in 1922, is published weekly in Yelm and has been a sister publication of The Chronicle of Centralia since 1994.[63][64] Tenino had several competing newspapers during the 1910s that were succeeded by the Tenino Independent, which has been published weekly since 1922.[60][64] An alt weekly, the Weekly Volcano was published in Olympia from 2001 to 2013;[65][66] it was later revived in 2023.[67] The Journal of Olympia, Lacey & Tumwater (JOLT) is a non-profit online news organization that was founded in 2020.[68]
Libraries
[edit]Thurston County is part of the Timberland Regional Library, a public library system that serves five counties in southwestern Washington and is headquartered in Tumwater.[69] It has seven locations in the county and a dedicated bookmobile service.[70] Thurston County is a founding member of the Timberland system, which was established as a pilot project in 1964 and made into a permanent intercounty rural library district in 1968. The county had previously been served by the South Puget Sound Regional Library, which was contracted to operate libraries in the cities of Lacey, Olympia, and Yelm. These cities were later annexed directly into the Timberland system by the 1980s.[71][72] The oldest public library in the county was opened in 1896 by the Woman's Club of Olympia, who donated their collection of 900 books to the city government in 1909. A permanent Carnegie library in Olympia was opened in 1914 with 1,500 books and was used by the city and Timberland until a new library building opened in 1978.[73]
Infrastructure
[edit]Transportation
[edit]Thurston County is bisected by Interstate 5, the major north–south freeway on the U.S. West Coast that connects Washington, Oregon, and California.[74] The freeway travels through Grand Mound, Tumwater, Olympia, and Lacey and continues south to Portland, Oregon, and north to Tacoma and Seattle. It was constructed in the 1950s and 1960s to replace U.S. Route 99, the original north–south highway in Western Washington.[12] Interstate 5 intersects several other highways within Thurston County that provide connections to other areas of Washington state. These include U.S. Route 12, which travels west from Grand Mound to Aberdeen; U.S. Route 101, which encircles most of the Olympic Peninsula and provides access to Aberdeen via State Route 8; and State Route 510, which travels along the Nisqually River to Yelm, where it intersects State Route 507.[75][76]
The county has two public transportation providers and connections to other systems that serve neighboring counties. Intercity Transit has 18 routes that serve the cities and urban growth areas of Olympia, Lacey, Tumwater, and Yelm. In addition to local service, the agency operates The One, a rapid bus service in Olympia and Lacey, and express buses to Lakewood that connect with Pierce Transit and Sound Transit.[77][78] All routes in the Intercity Transit system have been fare-free since 2020; the agency is funded by a local sales tax within its service area, which was formed in 1980.[79][80] Rural Transit is operated by the Thurston Regional Planning Council between communities south of Olympia and Tumwater. It is also fare-free and connects with Lewis County Transit in Centralia.[81]
Passenger rail service through Thurston County is operated by Amtrak, which has two routes that serve Centennial Station in southern Lacey, which opened in 1993 and is primarily run by volunteers.[82] The Cascades has several daily trips to Seattle, Portland, and Vancouver; the Coast Starlight has one daily train that runs between Seattle, Sacramento, the San Francisco Bay Area, and Los Angeles.[83][84] These routes run on tracks owned by the BNSF Railway, which primarily operates freight trains through the county on the Seattle Subdivision. Several branch railroads also pass through Thurston County, including the Puget Sound and Pacific Railroad and two lines owned by the Port of Olympia that were leased to Tacoma Rail until 2016.[85][86]
The county has one public airport, Olympia Regional Airport, which is owned by the Port of Olympia and used for general aviation, business flights, air ambulances, and government use. It has two runways, a passenger terminal, and an air traffic control tower.[87] The airport and two other sites in Thurston County were among candidates considered by a state legislative commission for a new passenger airport to relieve crowding at Seattle–Tacoma International Airport, the main passenger airport in the region.[88]
Utilities
[edit]The county's customer electricity and natural gas is provided by Puget Sound Energy, a private company that serves most of the Seattle metropolitan area. The company has 1,332 miles (2,144 km) of overhead lines and 1,332 miles (2,144 km) underground lines to serve over 131,000 total customers in Thurston County. Puget Sound Energy's natural gas infrastructure includes 973 miles (1,566 km) of mains in the county. Several public utilities, including city governments and county-owned rural systems, provide water to residents and businesses.[89]
Healthcare
[edit]Thurston County has two major hospitals that have a combined 500-bed capacity. The largest is Providence St. Peter Hospital north of Lacey, which has 390 beds and is operated by Providence Health & Services.[90] It was founded in 1887 at a location in Olympia and moved to its current campus near Lacey in 1971.[91][92] The Capital Medical Center in Olympia, operated by MultiCare Health since 2021, has 107 beds and an off-campus emergency room in Lacey.[93][94] It was built in 1985 to address a shortage in hospital capacity in the South Puget Sound region.[95]
Communities
[edit]
Cities
[edit]Towns
[edit]Census-designated places
[edit]Unincorporated communities
[edit]Ghost towns
[edit]See also
[edit]- National Register of Historic Places listings in Thurston County, Washington
- History of Washington (state)
- History of Olympia, Washington
References
[edit]- ^ a b c d "State & County QuickFacts: Thurston County, Washington". United States Census Bureau. Retrieved June 15, 2025.
- ^ "Find a County". National Association of Counties. Retrieved June 7, 2011.
- ^ Reinartz, Kay. "History of King County Government 1853–2002" (PDF). Archived from the original (PDF) on December 1, 2007. Retrieved December 29, 2007.
- ^ "Milestones for Washington State History — Part 2: 1851 to 1900". HistoryLink.org. March 6, 2003.
- ^ "Thurston County Place Names: A Heritage Guide" (PDF). Thurston County Historical Commission. 1992. p. 87. Archived (PDF) from the original on September 18, 2015. Retrieved March 28, 2018.
- ^ Thompson, Lorrine (January 31, 2002). "Tribes play key role in county's history". The Olympian. pp. 36–37. Retrieved October 23, 2024 – via Newspapers.com.
- ^ a b c d e f g h i Dougherty, Phil (November 15, 2006). "Thurston County — Thumbnail History". HistoryLink. Retrieved June 15, 2025.
- ^ a b c d e f Stevenson, Shanna (January 31, 2002). "Petitions, meetings led to county's birth". The Olympian. pp. 6, 8. Retrieved October 23, 2024 – via Newspapers.com.
- ^ Longoria, Ruth (January 31, 2002). "County's namesake never visited here". The Olympian. p. 35. Retrieved October 23, 2024 – via Newspapers.com.
- ^ a b Long, John H., ed. (2007). "Washington: Individual County Chronologies". Atlas of Historical County Boundaries. Newberry Library. Retrieved October 23, 2024.
- ^ Nicandri, David L. (November 26, 1974). "National Register of Historic Places Inventory—Nomination Form: Thurston County Courthouse/Washington State Capitol Building". National Park Service. pp. 2, 5–9. Retrieved June 15, 2025.
- ^ a b c Batcheldor, Matt (December 7, 2008). "I-5 at 50: It's changed the face of the region". The Olympian. pp. A1–A2. Retrieved October 23, 2024 – via Newspapers.com.
- ^ Gough, William (February 8, 1987). "Olympia traffic mess to end—eventually". The Seattle Times. p. B2.
- ^ "Found: A Missing Link (And It's Open)". The Olympian. November 21, 1968. p. 1. Retrieved October 23, 2024 – via Newspapers.com.
- ^ "Restriction maps - Racial Restrictive Covenants Project". depts.washington.edu. Retrieved April 10, 2025.
- ^ "Understanding Restrictive Covenants - Racial Restrictive Covenants Project". depts.washington.edu. Retrieved April 10, 2025.
- ^ "Understanding Restrictive Covenants - Racial Restrictive Covenants Project". depts.washington.edu. Retrieved April 10, 2025.
- ^ a b c "Restricted Properties - Olympia and Thurston County - Racial Restrictive Covenants Project". depts.washington.edu. Retrieved April 10, 2025.
- ^ "Mapping Race and Segregation in Olympia and Thurston County, Washington, 1980-2020 - Civil Rights & Labor History Consortium". depts.washington.edu. Retrieved June 15, 2025.
- ^ "2010 Census Gazetteer Files". United States Census Bureau. August 22, 2012. Retrieved July 16, 2015.
- ^ Sailor, Craig (July 22, 2023). "Rare South Sound blossom makes comeback". The Olympian. Retrieved September 1, 2023.
- ^ Browne Grivas, Erica (May 9, 2023). "Why conservation groups are trying to restore native prairies in WA". The Seattle Times. Retrieved September 1, 2023.
- ^ "Thurston County profile". Washington State Employment Security Department. June 2025. Retrieved July 2, 2025.
- ^ "Occupational Employment and Wages in Olympia-Tumwater — May 2024". U.S. Bureau of Labor Statistics. May 15, 2025. Retrieved June 26, 2025.
- ^ "Thurston County Washington, Annual Comprehensive Financial Report, For Year Ended December 31, 2023" (PDF). Thurston County. June 30, 2024. p. 278. Retrieved July 2, 2025.
- ^ "County Population Totals and Components of Change: 2020-2024". United States Census Bureau. Retrieved May 17, 2025.
- ^ "U.S. Decennial Census". United States Census Bureau. Retrieved January 8, 2014.
- ^ "Historical Census Browser". University of Virginia Library. Retrieved January 8, 2014.
- ^ "Population of Counties by Decennial Census: 1900 to 1990". United States Census Bureau. Retrieved January 8, 2014.
- ^ "Census 2000 PHC-T-4. Ranking Tables for Counties: 1990 and 2000" (PDF). United States Census Bureau. Archived from the original (PDF) on February 26, 2015. Retrieved January 8, 2014.
- ^ Bilbao, Martín (September 26, 2021). "Census data shows how Thurston County has become more diverse over last decade". The Olympian. Retrieved October 27, 2024.
- ^ Schrager, Daniel (July 4, 2024). "Is Lacey's population growing faster than Olympia's? New data shows largest cities in WA". The Olympian. Retrieved October 27, 2024.
- ^ 2024 Population Trends (PDF) (Report). Washington State Office of Financial Management. September 2024. p. 18. Retrieved October 27, 2024.
- ^ Hobbs, Andy (April 2, 2017). "Olympia area among nation's fastest-growing communities, according to census". The Olympian. Retrieved October 27, 2024.
- ^ Balk, Gene (October 24, 2024). "Olympia ranked No. 1 in U.S. for share of middle-class residents". The Seattle Times. Retrieved October 27, 2024.
- ^ Seattle–Tacoma, WA Combined Statistical Area (PDF) (Map). United States Census Bureau. February 2013. Retrieved October 27, 2024.
- ^ "US Census Bureau, Table P16: Household Type". United States Census Bureau. Retrieved June 15, 2025.
- ^ "How many people live in Thurston County, Washington". USA Today. Retrieved November 9, 2024.
- ^ a b c "DP-1 Profile of General Population and Housing Characteristics: 2010 Demographic Profile Data". United States Census Bureau. Archived from the original on February 13, 2020. Retrieved March 6, 2016.
- ^ "Population, Housing Units, Area, and Density: 2010 – County". United States Census Bureau. Archived from the original on February 13, 2020. Retrieved March 6, 2016.
- ^ "DP02 SELECTED SOCIAL CHARACTERISTICS IN THE UNITED STATES – 2006–2010 American Community Survey 5-Year Estimates". United States Census Bureau. Archived from the original on February 13, 2020. Retrieved March 6, 2016.
- ^ "DP03 SELECTED ECONOMIC CHARACTERISTICS – 2006–2010 American Community Survey 5-Year Estimates". United States Census Bureau. Archived from the original on February 13, 2020. Retrieved March 6, 2016.
- ^ Bilbao, Martín (January 16, 2025). "Finalized Thurston County homeless census counted more people in 2024. New census starts soon". The Olympian. Retrieved March 4, 2025.
- ^ Bilbao, Martín (November 29, 2023). "New Thurston County, Port of Olympia Commissioners sworn in Tuesday". The Olympian. Retrieved October 23, 2024.
- ^ Bilbao, Martín (February 14, 2024). "Thurston County commissioners select new county manager who left California amid controversy". The Olympian. Retrieved October 23, 2024.
- ^ Thompson, Lorrine (January 31, 2002). "Government structure unchanged since 1852". The Olympian. p. 30. Retrieved October 23, 2024 – via Newspapers.com.
- ^ Norstadt, Andy (November 14, 1985). "Home rule an option". The Olympian. p. B1. Retrieved October 23, 2024 – via Newspapers.com.
- ^ a b Washington State Legislative & Congressional District Map (PDF) (Map). Washington State Redistricting Commission. July 2024. Olympia inset. Retrieved October 24, 2024.
- ^ Shannon, Brad; Schrader, Jordan (February 27, 2011). "District shuffle to begin". The Olympian. Retrieved October 24, 2024.
- ^ McCarthy, Pat (December 16, 2024). "Accountability Audit Report, Thurston County, For the period January 1, 2023 through December 31, 2023". Office of the Washington State Auditor. p. 8. Retrieved June 25, 2025.
- ^ Thurston County Fire Districts map[usurped] Retrieved January 20, 2024.
- ^ "Thurston County November 5, 2024 General Election". results.vote.wa.gov.
- ^ Bilbao, Martin (December 18, 2024). "New Thurston County Commissioner Rachel Grant sworn-in Tuesday as Gary Edwards retires". The Olympian. Retrieved June 15, 2025.
- ^ Leip, David. "Dave Leip's Atlas of U.S. Presidential Elections". uselectionatlas.org. Retrieved April 10, 2018.
- ^ The leading "other" candidate, Progressive Theodore Roosevelt, received 1,471 votes, while Socialist candidate Eugene Debs received 1,160 votes, Prohibition candidate Eugene Chafin received 270 votes, and Socialist Labor candidate Arthur Reimer received 17 votes.
- ^ 2020 Census – School District Reference Map: Thurston County, WA (PDF) (Map). United States Census Bureau. Archived (PDF) from the original on October 9, 2022. Retrieved July 20, 2022. – Text list – List of districts based in Thurston County
- ^ Dougher, Sarah (January 13, 2013). "Revolution Come and Gone: On K Records". Los Angeles Review of Books. Retrieved October 27, 2024.
- ^ Shannon, Madeline (July 24, 2020). "McClatchy sold to New Jersey hedge fund". The JOLT. Retrieved October 25, 2024.
- ^ Opong, Diana (March 5, 2024). "Seattle area McClatchy newspapers move to printing just 3 days per week". KUOW. Retrieved October 25, 2024.
- ^ a b c "The Decline of Local News and Its Impact on Democracy" (PDF). League of Women Voters of Washington. November 2022. pp. 86, 108. Retrieved October 25, 2024.
- ^ Oakland, Mike (August 28, 2005). "Another step in South Sound's 150-year newspaper tradition". The Olympian. p. A5. Retrieved October 25, 2024 – via Newspapers.com.
- ^ Queary, Paul (April 7, 2021). "Evicted: The Incredible Shrinking State House Press". Post Alley. Retrieved October 25, 2024.
- ^ Tomtas, Justyna (February 15, 2022). "Nisqually Valley News Celebrates 100th Anniversary". Nisqually Valley News. Retrieved October 27, 2024.
- ^ a b Dwelley, Arthur G. (June 14, 1988). "Peddling their papers: Early gypsy journalists left inky mark". The Olympian. p. C1. Retrieved October 27, 2024 – via Newspapers.com.
- ^ "Poster artists, music group, paper win city recognition". The News Tribune. September 30, 2007. p. E4. Retrieved October 27, 2024 – via Newspapers.com.
- ^ Nagle, Matt (April 30, 2013). "Changes come to Weekly Volcano". Tacoma Weekly. Archived from the original on July 30, 2017. Retrieved October 27, 2024.
- ^ Bryan, Saint (September 12, 2023). "Dormant for years, Tacoma's Weekly Volcano newspaper is about to erupt again". KING 5 News. Retrieved October 27, 2024.
- ^ Hare, Kristen (December 27, 2021). "More than 70 local newsrooms launched during the pandemic". Poynter Institute. Retrieved October 27, 2024.
- ^ Spegman, Abby (July 24, 2019). "As it plans for the future, hard feelings remain over Timberland's attempt to close libraries". The Olympian. Retrieved October 27, 2024.
- ^ "2023 Washington Public Library Statistical Report" (PDF). Washington Secretary of State. October 2024. pp. 125–126. Retrieved October 27, 2024.
- ^ "TRL Board of Trustees Manual: A History of Timberland Regional Library" (PDF). Timberland Regional Library. March 2013. pp. 1–6. Retrieved October 27, 2024.
- ^ "Voters Pass Library Plan". The Olympian. February 3, 1982. p. B2. Retrieved October 27, 2024 – via Newspapers.com.
- ^ Pemberton, Lisa (September 14, 2014). "100 years of going to the library". The Olympian. pp. A1, A18. Retrieved October 27, 2024 – via Newspapers.com.
- ^ Peterson, Josephine (October 1, 2024). "They cut costs in the '60s. Now part of I-5 faces flood danger or up to $4.2B to fix". The News Tribune. Retrieved October 24, 2024.
- ^ Washington State Department of Transportation (2014). Washington State Highways, 2014–2015 (PDF) (Map). 1:842,000. Olympia: Washington State Department of Transportation. Olympia inset. Retrieved October 24, 2024.
- ^ Thurston County Road Ownership (PDF) (Map). Thurston County GeoData Center. September 28, 2022. Retrieved October 26, 2024.
- ^ "About Us". Intercity Transit. Retrieved October 24, 2024.
- ^ Boone, Rolf (September 10, 2020). "Need a lift? Intercity Transit is set to expand bus service Sept. 20". The Olympian. Retrieved October 24, 2024.
- ^ Beekman, Daniel (November 13, 2023). "Clallam Transit will be latest of many WA systems to go fare-free". The Seattle Times. Retrieved October 24, 2024.
- ^ "Intercity Transit 2022 Annual Report, 2023–2028 Transit Development Plan" (PDF). Intercity Transit. August 2023. p. 2. Retrieved October 24, 2024.
- ^ Warn, Daniel (March 2, 2022). "Rural Transit Connects Those With Limited Public Transportation to Population Hubs Around Region". The Daily Chronicle. Retrieved October 24, 2024.
- ^ Hall, C.B. (February 21, 2012). "Amtrak finds it hard to take citizens' help, even when they build a station". Crosscut.com. Retrieved October 24, 2024.
- ^ Sailor, Craig (December 13, 2017). "One of the last great Washington train rides is coming to an end". The News Tribune. Retrieved October 24, 2024.
- ^ Paul, Crystal (March 29, 2019). "What it's like to take a 35-hour ride on Amtrak's Coast Starlight train from Los Angeles to Seattle". The Seattle Times. Retrieved October 24, 2024.
- ^ Cambridge Systematics; HDR, Inc. (May 2006). "Statewide Rail Capacity and Systems Needs Study Technical Memorandium" (PDF). Washington State Transportation Commission. pp. 7, 18, 35, 48–52. Retrieved October 24, 2024.
- ^ Hobbs, Andy (January 10, 2016). "Tacoma Rail to end short-line service to Thurston County". The Olympian. Retrieved October 24, 2024.
- ^ "Washington Electric Aircraft Feasibility Study" (PDF). Washington State Department of Transportation. November 2020. pp. 199–200. Retrieved October 24, 2024.
- ^ Relente, Angelica (July 19, 2023). "Where will Washington's new airport be? Locals are fighting against one of the options". The News Tribune. Retrieved October 24, 2024.
- ^ "Chapter 7: Utilities" (PDF). Thurston County Comprehensive Plan. Thurston County. November 2019. Retrieved March 4, 2025.
- ^ "Providence, Swedish health care systems unite under one brand". The Olympian. April 4, 2022. Retrieved November 4, 2024.
- ^ Hogan, Hal (January 6, 1971). "St. Peter Hospital: Switch Without a Hitch". The Olympian. p. 1. Retrieved November 4, 2024 – via Newspapers.com.
- ^ Satir, F.E. (July 10, 1997). "Times change, caring doesn't". The Olympian. p. D1. Retrieved November 4, 2024 – via Newspapers.com.
- ^ Boone, Rolf (March 5, 2021). "MultiCare says purchase price for Capital Medical Center is $44.6 million". The Olympian. Retrieved October 24, 2024.
- ^ Boone, Rolf (December 18, 2023). "Off-campus ER opens Friday, check out downtown winery and this pizzeria's new third site". The Olympian. Retrieved November 4, 2024.
- ^ Smith, Jeff (May 15, 1995). "Capital's growth mirrors nation". The Olympian. p. C4. Retrieved November 4, 2024 – via Newspapers.com.
External links
[edit] Geographic data related to Thurston County, Washington at OpenStreetMap
- Official county government website
- Thurston Conservation District
Places adjacent to Thurston County, Washington | ||||||||||||||||
|---|---|---|---|---|---|---|---|---|---|---|---|---|---|---|---|---|
| ||||||||||||||||
Municipalities and communities of Thurston County, Washington, United States | ||
|---|---|---|
| Cities | 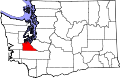 | |
| Town | ||
| CDPs | ||
| Unincorporated communities | ||
| Indian reservation | ||
| Ghost town | ||
| Footnotes | ‡This populated place also has portions in an adjacent county or counties | |
| International | |
|---|---|
| National | |
 EncycloReader
is supported by the
EncycloReader
is supported by the