Town of Alice Springs
 From Wikipedia - Reading time: 6 min
| Alice Springs Town Council Northern Territory | |||||||||||||||
|---|---|---|---|---|---|---|---|---|---|---|---|---|---|---|---|
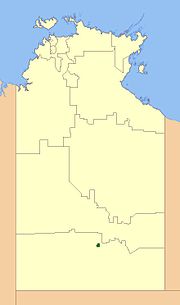
 Location of Alice Springs Town Council | |||||||||||||||
| Population | 26,534 (2018)[1] | ||||||||||||||
| • Density | 80.90/km2 (209.5/sq mi) | ||||||||||||||
| Established | 1971 | ||||||||||||||
| Area | 328 km2 (126.6 sq mi)[1] | ||||||||||||||
| Mayor | Matt Paterson | ||||||||||||||
| Council seat | Alice Springs | ||||||||||||||
| Region | Alice Springs Region | ||||||||||||||
| Territory electorate(s) | Araluen, Braitling, Namatjira | ||||||||||||||
| Federal division(s) | Lingiari | ||||||||||||||
 | |||||||||||||||
| Website | Alice Springs Town Council | ||||||||||||||
| |||||||||||||||
The Alice Springs Town Council is a local government area in the Northern Territory. On 1 July 1971, Alice Springs was gazetted as a Municipality with the town council elected on 25 July 1971.[2] It is situated 1,498 kilometres (931 mi) south of Darwin. The council governs an area of 328 square kilometres (127 sq mi) and had a population of 26,534 in June 2018.[1]
History
[edit]The town of Alice Springs is located in Arrernte Country. Its traditional name is Mparntwe.[3] Alice Springs is an established residential township with a commercial area and rural areas on the outskirts of the town. European settlement of the area dates from 1862.
The current mayor is Matt Paterson. He was elected in September 2021 at the age of 30, making him the youngest Mayor in Alice Springs history.[4] In addition to the Mayor, the Council contains eight other Councillors.[5]
Council
[edit]Mayorship
[edit]| Name | Role | Elected | Took Office |
|---|---|---|---|
| Matt Paterson | Mayor | 14 September 2021 | 15 September 2021 |
| Eli Melky | Deputy Mayor | 14 September 2021 | 15 September 2021 |
Current composition
[edit]| Name | Party | |
|---|---|---|
| Matt Paterson | Independent | |
| Eli Melky | Independent | |
| Marli Banks | Independent | |
| Allison Bitar | Independent Labor | |
| Steve Brown | Country Liberal | |
| Mark Coffey | Independent | |
| Kim Hopper | Independent | |
| Michael Liddle | Independent | |
| Gavin Morris | Independent | |
Past councillors
[edit]Election results
[edit]2021
[edit]| Party | Candidate | Votes | % | ±% | |
|---|---|---|---|---|---|
| Independent | Jimmy Cocking (elected 1) | 2,595 | |||
| Independent | Eli Melky (elected 2) | 1,366 | |||
| Independent | Mark Coffey (elected 3) | 1,089 | |||
| Independent | Marli Banks (elected 4) | 487 | |||
| Country Liberal | Steve Brown (elected 5) | 473 | |||
| Greens | Emily Webster | 436 | |||
| Independent | Michael Liddle (elected 8) | 425 | |||
| Independent | Allison Bitar (elected 7) | 385 | |||
| Independent | Kim Hopper (elected 6) | 372 | |||
| Country Liberal | Sean Heenan | 347 | |||
| Independent | Aaron Blacker | 336 | |||
| Independent | Catherine Satour | 326 | |||
| Independent | Darren Burton | 240 | |||
| Independent | Patrick Bedford | 229 | |||
| Independent | James Dash | 48 | |||
| Independent | Wayne Wright | 48 | |||
| Independent | Angus McIvor | 44 | |||
| Total formal votes | 9,246 | 90.1 | |||
| Informal votes | 1,015 | 9.9 | |||
| Turnout | 58.68 | −12.32 | |||
Suburbs
[edit]|
|
References
[edit]- ^ a b c "3218.0 – Regional Population Growth, Australia, 2017-18: Population Estimates by Local Government Area (ASGS 2018), 2017 to 2018". Australian Bureau of Statistics. Australian Bureau of Statistics. 27 March 2019. Retrieved 25 October 2019. Estimated resident population, 30 June 2018.
- ^ "Council History". Alice Springs Town Council. Retrieved 23 February 2010.
- ^ "A Town Like Mparntwe (Reprint) | IAD Press". iadpress.com. Retrieved 14 July 2021.
- ^ "Elected Members". Alice Springs Town Council. Retrieved 17 April 2023.
- ^ "Elected Members". Alice Springs Town Council. Retrieved 13 December 2017.
- ^ "Alice Springs - Councillor". Northern Territory Electoral Commission.
- ^ "Alice Springs Municipality". Place Names Committee of the Northern Territory. Northern Territory Government. Retrieved 23 February 2010.
 KSF
KSF