Union County, Pennsylvania
 From Wikipedia - Reading time: 12 min
Union County | |
|---|---|
 Old Union County Courthouse in New Berlin | |
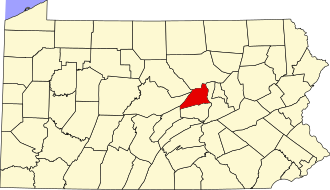
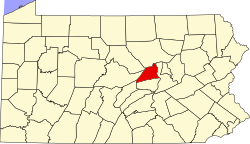
 Location within the U.S. state of Pennsylvania | |
 Pennsylvania's location within the U.S. | |
| Coordinates: 40°58′N 77°04′W / 40.96°N 77.06°W | |
| Country | |
| State | |
| Founded | March 22, 1813 |
| Seat | Lewisburg |
| Largest borough | Lewisburg |
| Area | |
• Total | 318 sq mi (820 km2) |
| • Land | 316 sq mi (820 km2) |
| • Water | 1.8 sq mi (5 km2) 0.6% |
| Population (2020) | |
• Total | 42,681 |
| • Density | 142/sq mi (55/km2) |
| Time zone | UTC−5 (Eastern) |
| • Summer (DST) | UTC−4 (EDT) |
| Congressional district | 15th |
| Website | unionco |
Union County is a county in the Commonwealth of Pennsylvania. As of the 2020 census, the population was 42,681.[1] Its county seat is Lewisburg.[2] The county was created on March 22, 1813, from part of Northumberland County. Its name is an allusion to the federal Union. Mifflinburg was established by legislation as the first county seat until it was moved to New Berlin in 1815. Lewisburg became county seat in 1855 and has remained so since. Union County comprises the Lewisburg, PA Micropolitan Statistical Area, which is also included in the Bloomsburg-Berwick-Sunbury, PA Combined Statistical Area. The county is part of the Central Pennsylvania region of the state.[a]
Geography
[edit]According to the U.S. Census Bureau, the county has a total area of 318 square miles (820 km2), of which 316 square miles (820 km2) is land and 1.8 square miles (4.7 km2) (0.6%) is water.[3] It is the fourth-smallest county in Pennsylvania by area. Union has a humid continental climate (Dfa/Dfb) and average temperatures in Lewisburg range from 27.2 °F in January to 72.7 °F in July, while in Hartleton they range from 26.4 °F in January to 72.1 °F in July.[4] Union County is one of the 423 counties served by the Appalachian Regional Commission,[5] and it is identified as part of the "Midlands" by Colin Woodard in his book American Nations: A History of the Eleven Rival Regional Cultures of North America.[6]
Adjacent counties
[edit]- Lycoming County (north)
- Northumberland County (east)
- Snyder County (south)
- Mifflin County (southwest)
- Centre County (west)
- Clinton County (northwest)
State protected areas
[edit]- R. B. Winter State Park
- Sand Bridge State Park
- Shikellamy State Park's overlook is in Union County. The marina is across the Susquehanna River in Northumberland County.
Major highways
[edit]Demographics
[edit]| Census | Pop. | Note | %± |
|---|---|---|---|
| 1820 | 18,619 | — | |
| 1830 | 20,795 | 11.7% | |
| 1840 | 22,787 | 9.6% | |
| 1850 | 26,083 | 14.5% | |
| 1860 | 14,145 | −45.8% | |
| 1870 | 15,565 | 10.0% | |
| 1880 | 16,905 | 8.6% | |
| 1890 | 17,820 | 5.4% | |
| 1900 | 17,592 | −1.3% | |
| 1910 | 16,249 | −7.6% | |
| 1920 | 15,850 | −2.5% | |
| 1930 | 17,468 | 10.2% | |
| 1940 | 20,247 | 15.9% | |
| 1950 | 23,150 | 14.3% | |
| 1960 | 25,646 | 10.8% | |
| 1970 | 28,603 | 11.5% | |
| 1980 | 32,870 | 14.9% | |
| 1990 | 36,176 | 10.1% | |
| 2000 | 41,624 | 15.1% | |
| 2010 | 44,947 | 8.0% | |
| 2020 | 42,681 | −5.0% | |
| U.S. Decennial Census[7] 1790–1960[8] 1900–1990[9] 1990–2000[10] 2010–2017[11] 2010-2020[12] | |||
As of the census[13] of 2000, there were 41,624 people, 13,178 households, and 9,211 families residing in the county. The population density was 131 people per square mile (51 people/km2). There were 14,684 housing units at an average density of 46 units per square mile (18/km2). The racial makeup of the county was 90.08% White, 6.91% Black or African American, 0.16% Native American, 1.06% Asian, 0.04% Pacific Islander, 0.37% from other races, and 1.37% from two or more races. 3.90% of the population were Hispanic or Latino of any race. 41.2% were of German, 13.9% American, 6.5% Irish, 5.9% English and 5.3% Italian ancestry. 90.4% spoke English, 3.7% Spanish, 2.0% Pennsylvania Dutch and 1.2% German as their first language.
There were 13,178 households, out of which 31.10% had children under the age of 18 living with them, 59.90% were married couples living together, 6.90% had a female householder with no husband present, and 30.10% were non-families. 25.30% of all households were made up of individuals, and 11.80% had someone living alone who was 65 years of age or older. The average household size was 2.50 and the average family size was 3.00.
In the county, the population was spread out, with 20.10% under the age of 18, 13.90% from 18 to 24, 30.90% from 25 to 44, 21.70% from 45 to 64, and 13.40% who were 65 years of age or older. The median age was 36 years. For every 100 females there were 123.90 males. For every 100 females age 18 and over, there were 128.50 males.
2020 census
[edit]| Race | Num. | Perc. |
|---|---|---|
| White (NH) | 36,050 | 84.46% |
| Black or African American (NH) | 2,459 | 5.76% |
| Native American (NH) | 73 | 0.2% |
| Asian (NH) | 814 | 2% |
| Pacific Islander (NH) | 8 | 0.02% |
| Other/Mixed (NH) | 1,268 | 3% |
| Hispanic or Latino | 2,000 | 4.7% |
Micropolitan Statistical Area
[edit]
The United States Office of Management and Budget[15] has designated Union County as the Lewisburg, PA Micropolitan Statistical Area (μSA). As of the 2010 census[16] the micropolitan area ranked 12th most populous in the State of Pennsylvania and the 263rd most populous in the United States with a population of 44,947. Union County is also a part of the Bloomsburg–Berwick–Sunbury, PA Combined Statistical Area (CSA), which combines the populations of Union County, as well as Columbia, Montour, Northumberland and Snyder Counties in Pennsylvania. The Combined Statistical Area ranked 8th in the State of Pennsylvania and 115th most populous in the United States with a population of 264,739.
Government
[edit]County commissioners
[edit]- Preston Boop (R)
- Jeff Reber (R)
- Stacy Richards (D)
State government
[edit]- Stephanie Borowicz – State Representative, Pennsylvania House of Representatives, District 76
- Jamie Flick - State Representative, Pennsylvania House of Representatives, District 83
- David H. Rowe – State Representative, Pennsylvania House of Representatives, District 85
- Gene Yaw – State Senator, Pennsylvania Senate, District 23
Federal level
[edit]- Glenn “G.T.” Thompson, Republican, Pennsylvania's 15th Congressional District in 2023 after redistricting.
- Dave McCormick, US Senator
- John Fetterman, US Senator
Politics
[edit]| Year | Republican | Democratic | Third party(ies) | |||
|---|---|---|---|---|---|---|
| No. | % | No. | % | No. | % | |
| 2024 | 12,969 | 61.01% | 8,015 | 37.71% | 273 | 1.28% |
| 2020 | 12,356 | 61.19% | 7,475 | 37.02% | 361 | 1.79% |
| 2016 | 10,622 | 60.02% | 6,180 | 34.92% | 894 | 5.05% |
| 2012 | 9,896 | 60.57% | 6,109 | 37.39% | 332 | 2.03% |
| 2008 | 9,859 | 56.42% | 7,333 | 41.96% | 283 | 1.62% |
| 2004 | 10,334 | 64.09% | 5,700 | 35.35% | 89 | 0.55% |
| 2000 | 8,523 | 64.69% | 4,209 | 31.95% | 443 | 3.36% |
| 1996 | 6,570 | 56.04% | 3,658 | 31.20% | 1,496 | 12.76% |
| 1992 | 6,362 | 51.87% | 3,623 | 29.54% | 2,280 | 18.59% |
| 1988 | 7,912 | 71.05% | 3,163 | 28.40% | 61 | 0.55% |
| 1984 | 7,792 | 73.66% | 2,747 | 25.97% | 40 | 0.38% |
| 1980 | 6,798 | 66.28% | 2,687 | 26.20% | 771 | 7.52% |
| 1976 | 6,309 | 63.71% | 3,405 | 34.39% | 188 | 1.90% |
| 1972 | 6,905 | 73.57% | 2,278 | 24.27% | 202 | 2.15% |
| 1968 | 6,422 | 69.69% | 2,178 | 23.64% | 615 | 6.67% |
| 1964 | 4,944 | 53.65% | 4,262 | 46.25% | 10 | 0.11% |
| 1960 | 7,466 | 78.82% | 1,993 | 21.04% | 13 | 0.14% |
| 1956 | 6,620 | 78.08% | 1,844 | 21.75% | 14 | 0.17% |
| 1952 | 6,558 | 80.16% | 1,610 | 19.68% | 13 | 0.16% |
| 1948 | 5,058 | 76.79% | 1,442 | 21.89% | 87 | 1.32% |
| 1944 | 5,585 | 76.19% | 1,704 | 23.25% | 41 | 0.56% |
| 1940 | 5,612 | 71.43% | 2,220 | 28.26% | 25 | 0.32% |
| 1936 | 5,589 | 64.97% | 2,946 | 34.25% | 67 | 0.78% |
| 1932 | 3,534 | 61.63% | 1,948 | 33.97% | 252 | 4.39% |
| 1928 | 5,708 | 87.45% | 765 | 11.72% | 54 | 0.83% |
| 1924 | 3,707 | 71.59% | 1,209 | 23.35% | 262 | 5.06% |
| 1920 | 3,305 | 71.38% | 1,155 | 24.95% | 170 | 3.67% |
| 1916 | 1,902 | 58.06% | 1,272 | 38.83% | 102 | 3.11% |
| 1912 | 470 | 13.56% | 1,126 | 32.50% | 1,869 | 53.94% |
| 1908 | 2,547 | 66.89% | 1,154 | 30.30% | 107 | 2.81% |
| 1904 | 2,548 | 69.26% | 1,034 | 28.11% | 97 | 2.64% |
| 1900 | 2,810 | 65.82% | 1,359 | 31.83% | 100 | 2.34% |
| 1896 | 2,585 | 65.63% | 1,186 | 30.11% | 168 | 4.27% |
| 1892 | 2,308 | 58.02% | 1,569 | 39.44% | 101 | 2.54% |
| 1888 | 2,448 | 59.85% | 1,582 | 38.68% | 60 | 1.47% |
| Year | Republican | Democratic | Third party(ies) | |||
|---|---|---|---|---|---|---|
| No. | % | No. | % | No. | % | |
| 2024 | 12,747 | 60.49% | 7,872 | 37.36% | 453 | 2.15% |
Andrew Jackson was the last Democratic Party candidate to win the county, in 1832. The county has been solidly Republican in Presidential elections since John C. Frémont's win against James Buchanan in 1856. The only exception was William Howard Taft's loss to Theodore Roosevelt of the Bull Moose (Progressive) Party – which had splintered from the Republican Party – in 1912.[19] The county has also voted for Republican Senators,[20] State Treasurers,[21] and State Auditors[22] for decades. Robert P. Casey is the only Democratic gubernatorial candidate to win the county in the last fifty years.[23] The county seat of Lewisburg is heavily Democratic, having given Joe Biden over 70% of its vote in 2020. However, the rest of the county is overwhelmingly Republican.[24]
Education
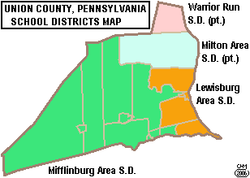
[edit]
Public school districts
[edit]- Lewisburg Area School District
- Mifflinburg Area School District
- Milton Area School District (also in Northumberland County)
- Warrior Run School District (also in Montour and Northumberland Counties)
Vocational school
[edit]- SUN Area Technical Institute - New Berlin
Higher education
[edit]- Bucknell University - Lewisburg
Private schools
[edit]- Beaver Run School - Lewisburg
- Bridgeville Parochial School - Mifflinburg
- Buffalo Creek Parochial School - Mifflinburg
- Calvary Holiness Academy - Millmont
- Camp Mount Luther - Mifflinburg
- County Line Amish School - Winfield
- East End Parochial School - Lewisburg
- Green Grove School - Mifflinburg
- Hartleton Mennonite School - Millmont
- Kumon Math and Learning of Lewisburg
- Limestone Valley Parochial School - Mifflinburg
- Morningstar Mennonite School - Mifflinburg
- Mountain Laurel School
- Mountain View Parochial School
- Norbrld Area Head Start Central Susquehanna Intermediate Unit 16
- Ridge View Parochial School
- Shady Grove Christian School
- Snyder Union Mifflin Child Development - Mifflinburg
- Sunnyside School - Millmont
- Union Co ARC Child Development Center - Lewisburg
- Union Co CC and Learning Center - Lewisburg
- White Springs School - Mifflinburg
Communities
[edit]
Under Pennsylvania law, there are four types of incorporated municipalities: cities, boroughs, townships, and, in most cases, towns. The following boroughs and townships are located in Union County:
Boroughs
[edit]- Hartleton
- Lewisburg (county seat)
- Mifflinburg
- New Berlin
Townships
[edit]Census-designated places
[edit]Census-designated places are geographical areas designated by the U.S. Census Bureau for the purposes of compiling demographic data. They are not actual jurisdictions under Pennsylvania law. Other unincorporated communities, such as villages, may be listed here as well.
Population ranking
[edit]The population ranking of the following table is based on the 2010 census of Union County.[16]
† county seat
| Rank | City/Town/etc. | Municipal type | Population (2010 Census) |
|---|---|---|---|
| 1 | † Lewisburg | Borough | 5,792 |
| 2 | Mifflinburg | Borough | 3,540 |
| 3 | Linntown | CDP | 1,489 |
| 4 | New Columbia | CDP | 1,013 |
| T-5 | West Milton | CDP | 900 |
| T-5 | Winfield | CDP | 900 |
| 6 | New Berlin | Borough | 873 |
| 7 | Allenwood | CDP | 321 |
| 8 | Hartleton | Borough | 283 |
| 9 | Vicksburg | CDP | 261 |
| 10 | Laurelton | CDP | 221 |
See also
[edit]References
[edit]- ^ Includes Centre, Lycoming, Northumberland, Columbia, Mifflin, Union, Snyder, Clinton, Juniata and Montour Counties
- ^ "Census - Geography Profile: Union County, Pennsylvania". United States Census Bureau. Retrieved December 18, 2022.
- ^ "Find a County". National Association of Counties. Retrieved June 7, 2011.
- ^ "2010 Census Gazetteer Files". United States Census Bureau. August 22, 2012. Retrieved March 11, 2015.
- ^ "PRISM Climate Group at Oregon State University".
- ^ "About the Appalachian Region". Appalachian Regional Commission. Retrieved June 23, 2024.
- ^ Woodard, Colin (July 30, 2018). "The Maps That Show That City vs. Country Is Not Our Political Fault Line". New York Times. Retrieved July 30, 2018.
- ^ "U.S. Decennial Census". United States Census Bureau. Retrieved March 11, 2015.
- ^ "Historical Census Browser". University of Virginia Library. Retrieved March 11, 2015.
- ^ Forstall, Richard L., ed. (March 24, 1995). "Population of Counties by Decennial Census: 1900 to 1990". United States Census Bureau. Retrieved March 11, 2015.
- ^ "Census 2000 PHC-T-4. Ranking Tables for Counties: 1990 and 2000" (PDF). United States Census Bureau. April 2, 2001. Archived (PDF) from the original on October 9, 2022. Retrieved March 11, 2015.
- ^ "State & County QuickFacts". United States Census Bureau. Archived from the original on January 10, 2016. Retrieved November 22, 2013.
- ^ "Census 2020".
- ^ "U.S. Census website". United States Census Bureau. Retrieved May 14, 2011.
- ^ "P2 HISPANIC OR LATINO, AND NOT HISPANIC OR LATINO BY RACE – 2020: DEC Redistricting Data (PL 94-171) – Union County, Pennsylvania".
- ^ "Office of Management and Budget". White House. Retrieved March 23, 2018.
- ^ a b Promotions, Center for New Media and. "US Census Bureau 2010 Census". www.census.gov. Retrieved March 23, 2018.
- ^ Leip, David. "Dave Leip's Atlas of U.S. Presidential Elections". uselectionatlas.org. Retrieved March 23, 2018.
- ^ "2024 Senate Election (Official Returns)". Commonwealth of Pennsylvania by county. November 5, 2024. Retrieved December 5, 2024.
- ^ "Presidential Elections". staffweb.wilkes.edu. Retrieved March 23, 2018.
- ^ "David Leip's Atlas". uselectionatlas.org. Retrieved March 23, 2018.
- ^ "David Leip's Atlas". uselectionatlas.org. Retrieved March 23, 2018.
- ^ "David Leip's Atlas". uselectionatlas.org. Retrieved March 23, 2018.
- ^ "David Leip's Atlas". uselectionatlas.org. Retrieved March 23, 2018.
- ^ "Dave Leip's Atlas of U.S. Presidential Elections".
- Snyder, Charles M. Union County, Pennsylvania: A Celebration of History, Penn State Press, 2001 ISBN 0-917127-13-7
External links
[edit] Media related to Union County, Pennsylvania at Wikimedia Commons
 KSF
KSF