Wangen, Schwyz
 From Wikipedia - Reading time: 9 min
Wangen | |
|---|---|
 | |
| Coordinates: 47°11′N 8°54′E / 47.183°N 8.900°E | |
| Country | Switzerland |
| Canton | Schwyz |
| District | March |
| Government | |
| • Mayor | Daniel Hüppin-Meister |
| Area | |
• Total | 10.86 km2 (4.19 sq mi) |
| Elevation | 424 m (1,391 ft) |
| Population (31 December 2018)[2] | |
• Total | 5,053 |
| • Density | 470/km2 (1,200/sq mi) |
| Time zone | UTC+01:00 (Central European Time) |
| • Summer (DST) | UTC+02:00 (Central European Summer Time) |
| Postal code(s) | 8855 |
| SFOS number | 1349 |
| ISO 3166 code | CH-SZ |
| Surrounded by | Galgenen, Jona (SG), Lachen, Schübelbach, Tuggen |
| Website | www SFSO statistics |
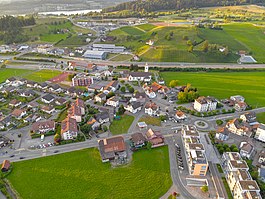
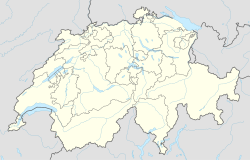
Wangen is a municipality in March District in the canton of Schwyz in Switzerland. The municipality includes Wangen itself, together with the hamlet of Nuolen.
Geography
[edit]
Wangen has an area, as of 2006[update], of 8.5 km2 (3.3 sq mi). Of this area, 64.9% is used for agricultural purposes, while 10.3% is forested. Of the rest of the land, 21.3% is settled (buildings or roads) and the remainder (3.6%) is non-productive (rivers, glaciers or mountains).[3] The Buechberg hill is located on the area of the municipality.
History
[edit]
Count Fridrich von Toggenburg, Herr zu Brettengow und Tafas donated to his own and the salvation of his ancestor who were buried and he also expects to be buried, the church, rights and lands (Kirchwidem and Kirchensatz) in Wangen in der March to the Rüti Monastery, sealed by Fridrich and the knights Herman von Landenberg, Johans von Bonstetten from Ustra and Herman von der Hochenlandenberg on 21 January 1407.[4]
Demographics
[edit]Wangen has a population (as of 31 December 2020) of 5,344.[5] As of 2007[update], 13.9% of the population was made up of foreign nationals.[6] Over the last 10 years the population has grown at a rate of 4.1%.[Figures don't agree.] Most of the population (as of 2000[update]) speaks German (92.0%), with Albanian being second most common ( 2.0%) and Italian being third ( 1.7%).[3]
As of 2000[update] the gender distribution of the population was 50.1% male and 49.9% female. The age distribution, as of 2008[update], in Wangen is; 1,247 people or 27.5% of the population is between 0 and 19. 1,399 people or 30.8% are 20 to 39, and 1,400 people or 30.8% are 40 to 64. Among older people: 310 people or 6.8% are 65 to 74. There are 143 people or 3.1% who are 70 to 79[Age bands don't line up] and 41 people or 0.90% of the population who are over 80.[6]
As of 2000[update] there are 1,753 households, of which 453 households (or about 25.8%) contain only a single individual. 128 or about 7.3% are large households, with at least five members.[6]
In the 2007 election the most popular party was the SVP which received 50.3% of the vote. The next three most popular parties were the SPS (17.7%), the FDP (15.5%) and the CVP (12.6%).[3]
In Wangen about 68.9% of the population (between age 25-64) have completed either non-mandatory upper secondary education or additional higher education (either university or a Fachhochschule).[3]
Wangen has an unemployment rate of 1.21%. As of 2005[update], there were 158 people employed in the primary economic sector and about 56 businesses involved in this sector. 387 people are employed in the secondary sector and there are 70 businesses in this sector. 645 people are employed in the tertiary sector, with 138 businesses in this sector.[3]
From the 2000 census[update][needs update], 3,166 or 69.7% are Roman Catholic, while 744 or 16.4% belonged to the Swiss Reformed Church. Of the rest of the population, there are less than 5 individuals who belong to the Christian Catholic faith, there are 88 individuals (or about 1.94% of the population) who belong to the Orthodox Church, and there are less than 5 individuals who belong to another Christian church. There are 174 (or about 3.83% of the population) who are Islamic. There are 19 individuals (or about 0.42% of the population) who belong to another church (not listed on the census), 209 (or about 4.60% of the population) belong to no church, are agnostic or atheist, and 133 individuals (or about 2.93% of the population) did not answer the question.[6]
The historical population is given in the following table:[6]
| Year | Population |
|---|---|
| 1900 | 1,131 |
| 1950 | 2,284 |
| 1960 | 2,550 |
| 1970 | 2,989 |
| 1980 | 2,847 |
| 1990 | 3,411 |
| 2000 | 4,572 |
| 2005 | 4,664 |
| 2010 | 4,672 |
| 2015 | 4,926 |
| 2020 | 5,321 |
| 2023 | 5,443 |
References
[edit]- ^ a b "Arealstatistik Standard - Gemeinden nach 4 Hauptbereichen". Federal Statistical Office. Retrieved 13 January 2019.
- ^ "Ständige Wohnbevölkerung nach Staatsangehörigkeitskategorie Geschlecht und Gemeinde; Provisorische Jahresergebnisse; 2018". Federal Statistical Office. 9 April 2019. Retrieved 11 April 2019.
- ^ a b c d e Swiss Federal Statistical Office accessed 02-Sep-2009
- ^ "C II 12, Nr. 277 Graf Fridrich von Toggenburg, Herr zu Brettengow und Tafas, schenkt zum eigenen Seelenheil und dem seiner Vorfahren dem ... (1407.01.21)" (in German). Staatsarchiv des Kantons Zürich. Retrieved 2015-08-14.
- ^ "Ständige und nichtständige Wohnbevölkerung nach institutionellen Gliederungen, Geburtsort und Staatsangehörigkeit". bfs.admin.ch (in German). Swiss Federal Statistical Office - STAT-TAB. 31 December 2020. Retrieved 21 September 2021.
- ^ a b c d e Wangen SZ Facts & Figures (in German) accessed 22 March 2020
 KSF
KSF


