Categories
West Berkshire Council elections
 From Wikipedia - Reading time: 7 min
West Berkshire Council is the local authority for West Berkshire, a unitary authority in Berkshire, England. Until 1 April 1998 it was a non-metropolitan district called Newbury.
Council elections
[edit]Non-metropolitan district elections
[edit]- 1973 Newbury District Council election
- 1976 Newbury District Council election
- 1979 Newbury District Council election
- 1983 Newbury District Council election (New ward boundaries)[1]
- 1987 Newbury District Council election
- 1991 Newbury District Council election (District boundary changes took place but the number of seats remained the same)[2][3]
- 1995 Newbury District Council election
Unitary authority elections
[edit]| Year | Liberal Democrats | Conservative | Green | Labour | Independent | Notes | |||||
| 2000[4] | 28 | 25 | 0 | 0 | 1 | ||||||
| 2003[5] | 26 | 26 | 0 | 0 | 0 | New ward boundaries[6][7] | |||||
| 2007[8] | 16 | 36 | 0 | 0 | 0 | ||||||
| 2011[9] | 13 | 39 | 0 | 0 | 0 | ||||||
| 2015[10] | 4 | 48 | 0 | 0 | 0 | ||||||
| 2019[11] | 16 | 24 | 3 | 0 | 0 | New ward boundaries[12] | |||||
| 2023[13] | 29 | 11 | 2 | 1 | 0 | ||||||
Results maps
[edit]-
 2003 results map
 -
 2007 results map
 -
 2011 results map
 -
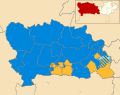
 2015 results map
 -
 2019 results map
 -
 2023 results map


By-elections
[edit]2003-2007
[edit]| Party | Candidate | Votes | % | ±% | |
|---|---|---|---|---|---|
| Liberal Democrats | Roger Hunneman | 727 | 58.6 | −5.3 | |
| Conservative | Jeffrey Beck | 461 | 37.2 | +6.8 | |
| Labour | Barry Lambert | 52 | 4.2 | +4.2 | |
| Majority | 266 | 21.5 | |||
| Turnout | 1,240 | ||||
| Liberal Democrats hold | Swing | ||||
| Party | Candidate | Votes | % | ±% | |
|---|---|---|---|---|---|
| Conservative | Sheila Ellison | 1,431 | 53.3 | +15.3 | |
| Liberal Democrats | Graham Reeves | 1,256 | 46.7 | −15.3 | |
| Majority | 175 | 6.6 | |||
| Turnout | 2,687 | ||||
| Conservative gain from Liberal Democrats | Swing | ||||
| Party | Candidate | Votes | % | ±% | |
|---|---|---|---|---|---|
| Conservative | 725 | 74.6 | +0.4 | ||
| Liberal Democrats | 151 | 15.5 | −0.4 | ||
| Labour | 96 | 9.9 | +0.0 | ||
| Majority | 574 | 59.1 | |||
| Turnout | 972 | ||||
| Conservative hold | Swing | ||||
2007-2011
[edit]| Party | Candidate | Votes | % | ±% | |
|---|---|---|---|---|---|
| Liberal Democrats | Bob Morgan | 936 | 58.6 | +1.9 | |
| Conservative | Dominic Boeck | 787 | 45.7 | −1.9 | |
| Majority | 149 | 8.6 | |||
| Turnout | 1,723 | ||||
| Liberal Democrats hold | Swing | ||||
2011-2015
[edit]| Party | Candidate | Votes | % | ±% | |
|---|---|---|---|---|---|
| Conservative | James Podger | 810 | 48.4 | −12.6 | |
| Liberal Democrats | Denise Gaines | 751 | 44.8 | +5.8 | |
| Labour | Gary Puffett | 86 | 5.1 | +5.1 | |
| Independent | Andrew Stott | 28 | 1.7 | +1.7 | |
| Majority | 59 | 3.5 | |||
| Turnout | 1,675 | ||||
| Conservative hold | Swing | ||||
| Party | Candidate | Votes | % | ±% | |
|---|---|---|---|---|---|
| Conservative | Rick Jones | 936 | 68.1 | +1.0 | |
| Labour | Ian Stevens | 172 | 12.5 | −8.7 | |
| UKIP | Catherine Anderson | 163 | 11.9 | +11.9 | |
| Liberal Democrats | Steve Bown | 104 | 7.6 | −4.1 | |
| Majority | 764 | 55.6 | |||
| Turnout | 1,375 | ||||
| Conservative hold | Swing | ||||
2015-2019
[edit]| Party | Candidate | Votes | % | ±% | |
|---|---|---|---|---|---|
| Conservative | Jason Collis | 1,823 | 48.7 | −0.6 | |
| Liberal Democrats | Owen Jeffery | 822 | 22.0 | −6.1 | |
| Green | Stephen Masters | 590 | 15.8 | +3.6 | |
| Labour | Nicholas East | 505 | 13.5 | +3.0 | |
| Majority | 1,001 | 26.8 | |||
| Turnout | 3,740 | ||||
| Conservative hold | Swing | ||||
| Party | Candidate | Votes | % | ±% | |
|---|---|---|---|---|---|
| Liberal Democrats | Jeff Brooks | 820 | 48.4% | +11.2% | |
| Conservative | Ellen Crumly | 523 | 30.9% | −18.1% | |
| Labour | Louise Coulson | 130 | 7.7% | −6.2% | |
| Green | Jane Livermore | 130 | 7.7% | +7.7% | |
| UKIP | Gary Johnson | 91 | 5.4% | +5.4% | |
| Registered electors | 4,957 | ||||
| Turnout | 1,702 | 34.3% | −34.3% | ||
| Liberal Democrats gain from Conservative | Swing | 14.7% | |||
2019-2023
[edit]| Party | Candidate | Votes | % | ±% | |
|---|---|---|---|---|---|
| Conservative | Akinbiyi Oloko | 548 | 42% | −18.5% | |
| Labour | Charles Croal | 387 | 30% | +4.7% | |
| Liberal Democrats | Steve Bown | 359 | 28% | +10.3% | |
| Registered electors | 5,652 | ||||
| Turnout | 1,302 | 23% | −5% | ||
| Conservative hold | Swing | -11.6% | |||
References
[edit]- ^ The District of Newbury (Electoral Arrangements) Order 1979
- ^ legislation.gov.uk - The Berkshire, Dorset and Wiltshire (County Boundaries) Order 1989. Retrieved on 5 November 2015.
- ^ legislation.gov.uk - The Berkshire, Buckinghamshire, Hampshire, Oxfordshire and Surrey (County Boundaries) Order 1991. Retrieved on 5 November 2015.
- ^ "West Berkshire". BBC News Online. Retrieved 25 December 2014.
- ^ "Local elections". BBC News Online. Retrieved 25 December 2014.
- ^ legislation.gov.uk - The District of West Berkshire (Electoral Changes) Order 2002. Retrieved on 4 October 2015.
- ^ "Councillors". West Berkshire Council. Retrieved 25 December 2014.
- ^ "West Berkshire". BBC News Online. 4 May 2007. Retrieved 25 December 2014.
- ^ "England council elections". BBC News Online. 10 May 2011. Retrieved 25 December 2014.
- ^ "Election results by party, 7 May 2015". decisionmaking.westberks.gov.uk. 7 May 2015.
- ^ "West Berkshire Council". BBC News.
- ^ "The West Berkshire (Electoral Changes) Order 2018". www.legislation.gov.uk.
- ^ "West Berkshire result - Local Elections 2023". BBC News. Retrieved 5 May 2023.
- ^ "Local Elections Archive Project — Victoria Ward". www.andrewteale.me.uk. Retrieved 21 February 2024.
- ^ "Declaration of Result of Poll - Victoria" (PDF). West Berkshire Council. Archived from the original (PDF) on 3 January 2007. Retrieved 21 February 2024.
- ^ "Local Elections Archive Project — Thatcham North Ward". www.andrewteale.me.uk. Retrieved 21 February 2024.
- ^ "Declaration of Result of Poll - Thatcham North" (PDF). West Berkshire Council. Archived from the original (PDF) on 3 January 2007. Retrieved 21 February 2024.
- ^ "Local Elections Archive Project — Pangbourne Ward". www.andrewteale.me.uk. Retrieved 21 February 2024.
- ^ "Local Elections Archive Project — Thatcham South and Crookham Ward". www.andrewteale.me.uk. Retrieved 21 February 2024.
- ^ "Local Elections Archive Project — Hungerford Ward". www.andrewteale.me.uk. Retrieved 21 February 2024.
- ^ "Election results for Hungerford, 15 August 2013". West Berkshire Council. 15 August 2013. Retrieved 21 February 2024.
- ^ "Local Elections Archive Project — Purley on Thames Ward". www.andrewteale.me.uk. Retrieved 21 February 2024.
- ^ "Local Elections Archive Project — Thatcham South and Crookham Ward". www.andrewteale.me.uk. Retrieved 21 February 2024.
- ^ "Declaration of Result of Poll". West Berkshire. 20 April 2018. Archived from the original on 21 April 2018. Retrieved 21 April 2018.
- ^ "Election results for Thatcham West District Election 2015". West Berkshire. 8 May 2015. Archived from the original on 21 April 2018. Retrieved 21 April 2018.
- ^ "Notice of Poll". West Berkshire Council. 8 December 2021. Retrieved 15 December 2018.
External links
[edit]
Licensed under CC BY-SA 3.0 | Source: https://en.wikipedia.org/wiki/West_Berkshire_Council_elections25 views | Status: cached on March 17 2025 02:15:59↧ Download as ZWI file
 EncycloReader
is supported by the
EncycloReader
is supported by the