Categories
Worthing Borough Council elections
 From Wikipedia - Reading time: 6 min
One third of Worthing Borough Council in Worthing, West Sussex, England is elected each year, followed by one year without election. Since the last boundary changes in 2004, 37 councillors are elected from 13 wards.[1]
Summary of results
[edit]| Year | Conservative | Liberal Democrats[a] | Labour | Green | UKIP | Independents & Others |
Council control after election | |
|---|---|---|---|---|---|---|---|---|
| Local government reorganisation; council established (30 seats) | ||||||||
| 1973 | 17 | 0 | 1 | – | – | 12 | Conservative | |
| 1976 | 26 | 0 | 1 | 0 | – | 3 | Conservative | |
| 1979 | 16 | 9 | 0 | 0 | – | 5 | Conservative | |
| New ward boundaries (36 seats) | ||||||||
| 1983 | 24 | 12 | 0 | 0 | – | 0 | Conservative | |
| 1984 | 24 | 12 | 0 | 0 | – | 0 | Conservative | |
| 1986 | 22 | 14 | 0 | 0 | – | 0 | Conservative | |
| 1987 | 24 | 12 | 0 | 0 | – | 0 | Conservative | |
| 1988 | 26 | 10 | 0 | 0 | – | 0 | Conservative | |
| 1990 | 27 | 9 | 0 | 0 | – | 0 | Conservative | |
| 1991 | 24 | 12 | 0 | 0 | – | 0 | Conservative | |
| 1992 | 22 | 14 | 0 | 0 | – | 0 | Conservative | |
| 1994 | 17 | 19 | 0 | 0 | 0 | 0 | Liberal Democrats | |
| 1995 | 13 | 23 | 0 | 0 | 0 | 0 | Liberal Democrats | |
| 1996 | 11 | 25 | 0 | 0 | 0 | 0 | Liberal Democrats | |
| 1998 | 15 | 21 | 0 | 0 | 0 | 0 | Liberal Democrats | |
| 1999 | 20 | 16 | 0 | 0 | 0 | 0 | Conservative | |
| 2000 | 20 | 16 | 0 | 0 | 0 | 0 | Conservative | |
| 2002 | 17 | 19 | 0 | 0 | 0 | 0 | Liberal Democrats | |
| 2003 | 18 | 18 | 0 | 0 | 0 | 0 | No overall control | |
| New ward boundaries (37 seats) | ||||||||
| 2004 | 26 | 11 | 0 | 0 | 0 | 0 | Conservative | |
| 2006 | 23 | 14 | 0 | 0 | 0 | 0 | Conservative | |
| 2007 | 24 | 12 | 0 | 0 | 0 | 1 | Conservative | |
| 2008 | 24 | 13 | 0 | 0 | 0 | 0 | Conservative | |
| 2010 | 25 | 12 | 0 | 0 | 0 | 0 | Conservative | |
| 2011 | 25 | 11 | 0 | 0 | 0 | 1 | Conservative | |
| 2012 | 24 | 12 | 0 | 0 | 0 | 1 | Conservative | |
| 2014 | 27 | 7 | 0 | 1 | 1 | 1 | Conservative | |
| 2015 | 30 | 4 | 0 | 1 | 1 | 1 | Conservative | |
| 2016 | 32 | 2 | 0 | 1 | 2 | 0 | Conservative | |
| 2018 | 29 | 2 | 5 | 0 | 1 | 0 | Conservative | |
| 2019 | 23 | 3 | 10 | 0 | 1 | 0 | Conservative | |
| 2021 | 19 | 3 | 15 | 0 | 0 | 0 | Conservative | |
| 2022 | 13 | 1 | 23 | 0 | 0 | 0 | Labour | |
| 2023 | 11 | 1 | 24 | 1 | 0 | 0 | Labour | |
| 2024 | 9 | 0 | 26 | 2 | 0 | 0 | Labour | |
Council elections
[edit]- 1973 Worthing Borough Council election
- 1976 Worthing Borough Council election
- 1979 Worthing Borough Council election
- 1983 Worthing Borough Council election (New ward boundaries)[3]
- 1984 Worthing Borough Council election
- 1986 Worthing Borough Council election (Borough boundary changes took place but the number of seats remained the same)[4]
- 1987 Worthing Borough Council election
- 1988 Worthing Borough Council election
- 1990 Worthing Borough Council election
- 1991 Worthing Borough Council election
- 1992 Worthing Borough Council election
- 1994 Worthing Borough Council election
- 1995 Worthing Borough Council election
- 1996 Worthing Borough Council election
- 1998 Worthing Borough Council election
- 1999 Worthing Borough Council election
- 2000 Worthing Borough Council election
- 2002 Worthing Borough Council election
- 2003 Worthing Borough Council election
- 2004 Worthing Borough Council election (New ward boundaries increased the number of seats by 1)[5][6]
- 2006 Worthing Borough Council election
- 2007 Worthing Borough Council election
- 2008 Worthing Borough Council election
- 2010 Worthing Borough Council election
- 2011 Worthing Borough Council election
- 2012 Worthing Borough Council election
- 2014 Worthing Borough Council election
- 2015 Worthing Borough Council election
- 2016 Worthing Borough Council election
- 2018 Worthing Borough Council election
- 2019 Worthing Borough Council election
- 2021 Worthing Borough Council election
- 2022 Worthing Borough Council election
- 2023 Worthing Borough Council election
- 2024 Worthing Borough Council Election
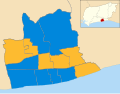
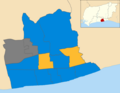
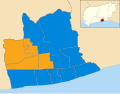
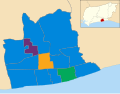
Borough result maps
[edit]-
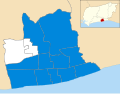
 2004 results map
 -
 2006 results map
 -
 2007 results map
 -
 2008 results map
 -
 2010 results map
 -
 2011 results map
 -
 2012 results map
 -
 2014 results map
 -
 2015 results map
 -
 2016 results map
 -
 2018 results map
 -
 2019 results map
 -
 2021 results map
 -
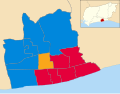
 2022 results map
 -
 2023 results map
 -
 2024 results map


Election apportionment diagrams
[edit]-
 2019 Election apportionment diagram
 -
 2021 Election apportionment diagram
 -
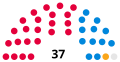 2022 Election apportionment diagram
 -
 2023 Election apportionment diagram


By-election results
[edit]2010-2014
[edit]| Party | Candidate | Votes | % | ±% | |
|---|---|---|---|---|---|
| Conservative | Mark Nolan | 997 | 43.7 | ||
| UKIP | Adrian Price | 769 | 33.7 | ||
| Labour | Janet Haden | 195 | 8.5 | ||
| Green | David Aherne | 171 | 7.5 | ||
| Liberal Democrats | Neil Campbell | 149 | 6.5 | ||
| Majority | 228 | 10.0 | |||
| Turnout | 2,281 | ||||
| Conservative hold | Swing | ||||
2014-2018
[edit]| Party | Candidate | Votes | % | ±% | |
|---|---|---|---|---|---|
| UKIP | Charles James | 568 | 36.9 | ||
| Conservative | Alex Harman | 485 | 31.5 | ||
| Liberal Democrats | Nicholas Wiltshire | 242 | 15.7 | ||
| Labour | Jim Deen | 197 | 12.8 | ||
| Green | Stefan Sykes | 49 | 3.2 | ||
| Majority | 83 | 5.4 | |||
| Turnout | 1,541 | ||||
| UKIP gain from Liberal Democrats | Swing | ||||
| Party | Candidate | Votes | % | ±% | |
|---|---|---|---|---|---|
| Labour | Rebecca Cooper | 1,032 | 47.4 | ||
| Conservative | Joseph Crouch | 846 | 38.8 | ||
| Liberal Democrats | Antony Brown | 246 | 11.3 | ||
| Green | Joanna Ponto | 55 | 2.5 | ||
| Majority | 186 | 8.6 | N/A | ||
| Turnout | 2,181 | 32.1 | |||
| Labour gain from Conservative | Swing | 17.6% | |||
2018-2022
[edit]| Party | Candidate | Votes | % | ±% | |
|---|---|---|---|---|---|
| Conservative | Richard Nowak | 2,690 | 60.4 | ||
| Labour | Gill Poole | 832 | 18.7 | ||
| Liberal Democrats | Emma Norton | 928 | 20.9 | ||
| Majority | 1762 | 39.6 | |||
| Turnout | 4,450 | 61.7 | |||
| Conservative hold | Swing | ||||
| Party | Candidate | Votes | % | ±% | |
|---|---|---|---|---|---|
| Labour | Vicki Wells | 1,239 | 50.2 | +3.2 | |
| Conservative | Syed Ahmed | 972 | 39.4 | −3.3 | |
| Green | Sonya Mallin | 145 | 5.9 | +0.1 | |
| Liberal Democrats | Emma Norton | 112 | 4.5 | +0.0 | |
| Majority | 267 | 10.8 | |||
| Turnout | 2,468 | ||||
| Labour gain from Conservative | Swing | ||||
2022-2026
[edit]| Party | Candidate | Votes | % | ±% | |
|---|---|---|---|---|---|
| Conservative | Thomas Taylor | 865 | 40.7 | +9.6 | |
| Labour | Mary Mernagh | 781 | 36.8 | −19.2 | |
| Reform UK | Lionel Harman | 228 | 10.7 | +10.7 | |
| Green | Jimi Taylor | 138 | 6.5 | −0.9 | |
| Liberal Democrats | Nick Wiltshire | 113 | 5.3 | −0.3 | |
| Majority | 84 | 4.0 | |||
| Turnout | 2,125 | ||||
| Conservative gain from Labour | Swing | ||||
| Party | Candidate | Votes | % | ±% | |
|---|---|---|---|---|---|
| Conservative | Luke Houghton | 742 | 42.0 | +15.8 | |
| Labour | Anthony Squires | 704 | 39.9 | −16.4 | |
| Green | Kate Thornton | 186 | 10.5 | +0.0 | |
| Liberal Democrats | Trudi Starling | 133 | 7.5 | +0.6 | |
| Majority | 38 | 2.2 | |||
| Turnout | 1,765 | ||||
| Conservative gain from Labour | Swing | ||||
Notes
[edit]- ^ Includes totals for the predecessors of the Liberal Democrats, the Liberal Party and SDP (both of which participated in the Alliance).
References
[edit]- ^ "Your Council". Worthing Borough Council. 19 May 2008. Retrieved 4 September 2009.
- ^ "Composition calculator". Colin Rallings & Michael Thrasher. The Elections Centre, Plymouth University. Retrieved 14 May 2025.
- ^ The Borough of Worthing (Electoral Arrangements) Order 1979
- ^ The Adur, Arun and Worthing (Areas) Order 1985
- ^ "Worthing council". BBC News Online. Retrieved 4 September 2009.
- ^ legislation.gov.uk - The Borough of Worthing (Electoral Changes) Order 2002. Retrieved on 4 October 2015.
- ^ "Local Elections Archive Project — Goring Ward". www.andrewteale.me.uk. Retrieved 28 September 2023.
- ^ "Local Elections Archive Project — Castle Ward". www.andrewteale.me.uk. Retrieved 28 September 2023.
- ^ "Election results 2017". Adur & Worthing Councils. Retrieved 18 September 2017.
- ^ "Local Elections Archive Project — Salvington Ward". www.andrewteale.me.uk. Retrieved 5 November 2024.
- ^ "Local Elections Archive Project — Marine Ward". www.andrewteale.me.uk. Retrieved 5 November 2024.
- ^ "Local Elections Archive Project — Marine Ward". www.andrewteale.me.uk. Retrieved 5 November 2024.
- ^ "Local Elections Archive Project — Heene Ward". www.andrewteale.me.uk. Retrieved 5 November 2024.
- By-election results Archived 29 March 2010 at the Wayback Machine
External links
[edit]| West Sussex CC | |
|---|---|
| Adur | |
| Arun | |
| Chichester | |
| Crawley | |
| Horsham | |
| Mid Sussex | |
| Worthing | |
| |
Licensed under CC BY-SA 3.0 | Source: https://en.wikipedia.org/wiki/Worthing_Borough_Council_elections58 views | Status: cached on August 14 2025 07:07:50↧ Download as ZWI file
 EncycloReader
is supported by the
EncycloReader
is supported by the