Climate graphs
 From Wikiversity - Reading time: 1 min
Introduction
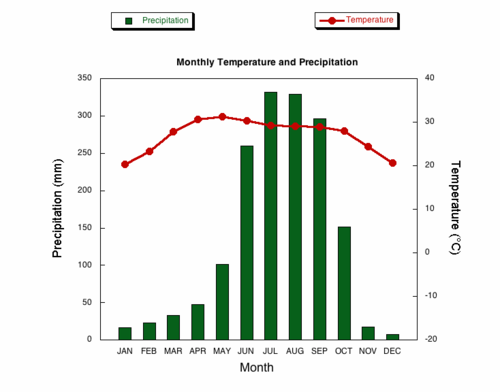
[edit | edit source]Climate graphs show average rainfall and temperatures at a specific location .
Starter
[edit | edit source]What can you tell me from looking at the graph ?
Teacher demo
[edit | edit source]A place's climate influences the types of vegetation and animals that live there.
- How do you think temperature and precipitation effects these places differently?
Example data
[edit | edit source]London Heathrow (airport); average rainfall and temperature
[edit | edit source]| Month | Jan | Feb | March | April | May | June | July | Aug | Sept | Oct | Nov | Dec |
|---|---|---|---|---|---|---|---|---|---|---|---|---|
| Rainfall (mm) | 56 | 40 | 50 | 51 | 50 | 53 | 48 | 50 | 49 | 81 | 61 | 58 |
| Temperature (°C) | 7 | 8 | 10 | 12 | 16 | 20 | 23 | 22 | 19 | 15 | 12 | 8 |
Licensed under CC BY-SA 3.0 | Source: https://en.wikiversity.org/wiki/Climate_graphs66 views | Status: cached on August 03 2025 20:10:31↧ Download this article as ZWI file
 KSF
KSF

