Correlation
 From Wikiversity - Reading time: 4 min
| Completion status: this resource is ~50% complete. |
Correlation (co-relation) refers to the degree of relationship (or dependency) between two variables.
Linear correlation refers to straight-line relationships between two variables.
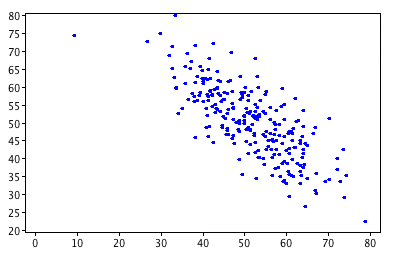
A correlation can range between -1 (perfect negative relationship) and +1 (perfect positive relationship), with 0 indicating no straight-line relationship.
The earliest known use of correlation was in the late 19th century[1].
Introduction
[edit | edit source]
When we ask questions such as "Is X related to Y?", "Does X predict Y?", and "Does X account for Y"?, we are interested in measuring and better understanding the relationship between two variables.
Correlation measures the extent to which variables:
- covary
- depend on one another
- predict one another
The extent of correlation between two variables, by convention, is denoted r, and the correlation between variable X and variable Y is indicated by rXY.
Correlations are standardised to vary between -1 and +1, with 0 representing no relationship, -1 a perfect negative relationship, and +1 a perfect positive relationship.
A variety of bivariate correlational statistics are available, the choice of which depends on the variables' level of measurement:
- Nominal by nominal: Contingency table, Pearson's chi-square test, Phi/Cramer's V
- Ordinal by ordinal: Spearman's rho, Kendall's tau-b
- Dichotomous by interval/ratio: Point biserial correlation coefficient
- Interval/ration by interval/ratio: Pearson product-moment correlation coefficient
Correlational analyses should be accompanied by appropriate bivariate graphs, such as:
- Nominal by nominal: Clustered bar charts
- Ordinal by ordinal: Scatterplot (with point bins)
- Interval/ratio by interval/ratio: Scatterplot
The world is made of covariation
[edit | edit source]
Responses which vary can be measured as a variable (i.e., responses are distributed across a range).
Responses to two or more variables may covary. These variables share some variation. When the value of one variable is high, the value of other variable tends to be high (positive correlation) or low (negative correlation).
If you look around, you may notice that the world is made of covariation! e.g.,
- pollen count is positively correlated with bee activity
- rainfall is positively correlated with amount of vegetation
- hours of study is positively correlated with test performance
- number of fire trucks attending a fire is correlated with cost of repairs for the fire[2]
- Sibling's IQ is positively correlated
- perceived air temperature is negatively correlated with amount of clothing worn
The more you look, the more you'll see that there are many predictable patterns of co-occurrence between phenomena (i.e., things tend to occur together).
Scatterplots
[edit | edit source]Independent variable (IV) (predictor) is placed on the X axis and dependent variable (DV) is placed on the Y axis. Each case is plotted according to its X and Y value.

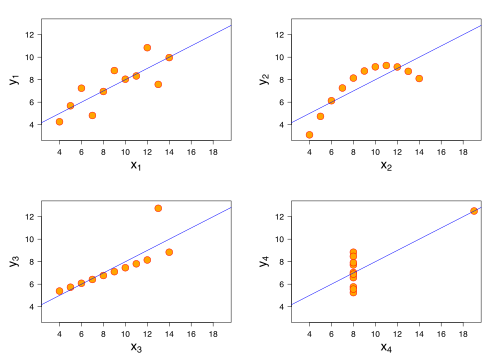
Visual inspection of scatterplots is essential
[edit | edit source]It is unwise to rely solely on correlation as a statistic that indicates the nature of the relationship between variables without also examining a visualisation of the data such as through a scatterplot.
For example, the linear (straight-line) correlation in each of these four scatterplots is .82, yet the nature of what the data indicated about the relationship between the variables is very different for each.

|
|
You can help expand this section. |
Homoscedasticity
[edit | edit source]

If the data are normally distributed, then scatterplots should be homoscedastistic (even spread about the line of best fit).
If data are not normally distributed (e.g., skewed), then the bivariate distribution may be heteroscedastic (uneven spread about the line of best fit). This violate the assumption of homoscedasticity for correlation.
For more information, see Homoscedasticity and Heteroscedasticity (Wikipedia).
Correlation does not equal causation
[edit | edit source]Correlation does not prove causation, although it may be consistent with causation. It is important to understand that correlation does not equal causation. A relationship between two variables may be caused by a third variable.

|
|
You can help expand this section. |
See Correlation does imply causation (Wikipedia)
Range restriction
[edit | edit source]
|
|
You can help expand this section. |
For more info, see the effect of range restrictions (Howell, 2009) and restricted range (Lane, n. d.).
For a practical tutorial, see outliers and restricted range.
Coefficient of determination
[edit | edit source]When a correlation coefficient (r) is squared (r2), this gives the coefficient of determination which is the percentage of variance shared between the two variables.
- See also
- Lecture slide
- References
- Allen & Bennett, 2010, p. 173
- Howell, 2010, p. 344
- Coefficient of determination (Wikipedia)
Interactive activity
[edit | edit source]Correlation guess: Correlation guess
Quiz
[edit | edit source]Test yourself: This is a pre-quiz to see what you already know - Introductory quiz
See also
[edit | edit source]- Correlation (Lecture)
- Correlation (Tutorial)
- Correlation (Wikipedia)
External links
[edit | edit source]- 11 ways to look at the chi-squared coefficient for contingency tables
- 13 ways to look at the correlation coefficient
- Correlation (Annis, 2008)
- Correlation (Garson, 2008)
- Correlation (Plonsky, 2006)
- Correlation (Trochim, 2006)
- Correlation coefficient (Hopkins, 2000)
- Correlation coefficients (Calkins, 2005)
- New poll shows correlation is causation (Humour)
- Rank order correlation (Lowry, 2008)
- Tutorial - Correlation (Neill, 2010)
- Understanding correlation (Rummel, 1976)
 KSF
KSF