Normal distribution
 From Wikiversity - Reading time: 4 min
Wiki2Reveal
[edit | edit source]This page can be displayed as Wiki2Reveal slides. Single sections are regarded as slides and modifications on the slides will immediately affect the content of the slides in RevealJS.
Introduction
[edit | edit source]A normal distribution can be described by four moments: mean, standard deviation, skewness and kurtosis. Statistical properties of normal distributions are important for parametric statistical tests which rely on assumptions of normality. The normal distribution is often used as assumption of the underlying probability distribution in natural sciences and social sciences[1][2]
Probability density function
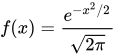
[edit | edit source]The probability density function of the standard normal distribution (with the standard deviation and area under the curve standardized to 1 and the mean and skewness standardized to 0) is given by
Antiderivative
[edit | edit source]This function has no elementary antiderivative, and thus normal distribution problems are mainly limited to using numerical integration to find a probability.
Gaussian integral and Normalization
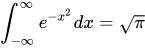
[edit | edit source]However, using multivariable calculus, the value of the Gaussian integral can be determined to be exactly , and through the change of variables , we can be assured that the total area beneath the curve is 1, and thus it is normalized correctly.

Standard Deviation
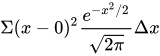
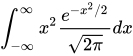
[edit | edit source]A similar approach can be used to prove that its standard deviation is also 1. By the definition of the standard deviation, , so we form the Riemann sum . Taking the limit of the sum leads to the integral .

Integration by Parts
[edit | edit source]Using integration by parts, we can determine that this is in fact equal to the area under the normal curve, and thus the standard deviation is 1.
Inflection Points
[edit | edit source]Using differentiation of the probability density function, we find that the inflection points of the normal distribution curve are each exactly one standard deviation away from the mean.
Standardization
[edit | edit source]Any other normal distribution can be standardized through a change of variables (such as if the mean is not 0).
Learning Task
[edit | edit source]- Learn about the general properties of a Probability Distribution and check why does the normal distribution fullfil these properities.
- Create number in R programming language R e.g. with Open Source R/RStudio and plot the generated data with a histogram.
- Analyze the Central Limit Theorem and describe, how the normal distribution is related to that theorem. Give an real world example where you would not assume a normal distribution.
Graphs 1 - Normal Distribution
[edit | edit source]
Graphs 2 - Normal Distribution
[edit | edit source]
Normal probability plots
[edit | edit source] |
Symbols
[edit | edit source]- Population mean = μ (Mu)
- Population variance = σ2 = (Sigma squared)
Testing for normality
[edit | edit source]No single indicator of normality should be overly relied upon. Graphical, descriptive, and inferential can be used, each with strengths and limitations. The most important result is to actually describe and show the distribution. Simply listing statistical properties does not demonstrate understanding.
Graphical analysis
[edit | edit source]Whether it is reported as a Figure or not, responses to interval or continuous variables should be visualised as a:
- Histogram, with normal curve imposed
This is the single most basic and important way of examining the central tendency and shape of distribution for participants' responses.
It may also be helpful to examine a:
- Normal Q-Q plot
Descriptive indicators of normality
[edit | edit source]A rule of thumb for assessing normality for the purposes of assumption testing for inferential statistical tests such as ANOVA is that if skewness and kurtosis are between -1 and +1 and there is a reasonable sample size (e.g., at least 20 per cell), then you are unlikely to run into issues related to violations of the assumption of normality.
Some authors suggest that variables with skewness and kurtosis values between -2 to +2 or even -3 to +3 can be treated as being drawn from a normally distributed population.
The larger the sample size, the more robust inferential tests are to departure from normality.
- The skewness of a Normal Distribution is always 0; +ve scores indicate a tail to the right; -ve scores indicate a tail to the left.
- The kurtosis of a Normal Distribution is always 0; +ve scores indicate a peaked distribution; -ve scores indicate a relatively flat distribution.
If concerned about non-normality, then consider recoding data to a lower level of measurement.
For more information, see: Judging severity of skewness and kurtosis
Inferential tests of normality
[edit | edit source]Significance tests of (non-)normality become overly sensitive when the sample size is large. Thus, do not rely on significance tests of normality alone in making an assessment (e.g., for assumption-testing purposes):
These tests are overly sensitive to minor departures from normality, particularly with large sample samples (e.g., > 200). This doesn't mean that it should be discounted as an indicator, just that a sig. (p < .05) test value does not necessarily indicate a notable or problematic departure from normality. Also check normality using other indicators.
Take-home message
[edit | edit source]It is recommended that both graphical indicators and descriptive indicators be used for testing the assumption that a sample is derived from a normally distributed population. Inferential normality tests may also be useful.
Dealing with non-normality
[edit | edit source]Transformations
[edit | edit source]Non-parametric statistics
[edit | edit source]External links
[edit | edit source]- Testing for normality using SPSS (Laerd Statistics]]
References
[edit | edit source]- ↑ Normal Distribution, Gale Encyclopedia of Psychology
- ↑ Casella & Berger (2001, p. 102)
See also
[edit | edit source]Page Information
[edit | edit source]You can display this page as Wiki2Reveal slides
Wiki2Reveal
[edit | edit source]The Wiki2Reveal slides were created for the Statistics' and the Link for the Wiki2Reveal Slides was created with the link generator.
- This page is designed as a PanDocElectron-SLIDE document type.
- Source: Wikiversity https://en.wikiversity.org/wiki/Normal_distribution
- see Wiki2Reveal for the functionality of Wiki2Reveal.
 EncycloReader
is supported by the
EncycloReader
is supported by the  KSF
KSF