Montana Gubernatorial And Lieutenant Gubernatorial Election, 2012
 From Ballotpedia
2016 →
|
| Montana gubernatorial and lieutenant gubernatorial election |
|---|
 |
June 5, 2012 |
November 6, 2012 |
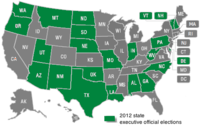
| State executive official elections in 2012 |
The Montana gubernatorial election took place on November 6, 2012. The primary election was held on June 5, 2012.
Both Montana's governor, Brian Schweitzer, and his lieutenant governor, John Bohlinger were prevented by term limits from seeking another term in office, leaving both seats open.[1]
In Montana, the governor and lieutenant governor are elected on a single ticket. In 2012, 11 sets of candidates entered the race: two Democrats, seven Republicans, one Libertarian, and one set of independent candidates. The field was whittled down to four after the two major parties selected their candidates in the June 5th primary:
![]() Steve Bullock and John E. Walsh (D)
Steve Bullock and John E. Walsh (D) ![]()
![]() Rick Hill and Jon Sonju (R)
Rick Hill and Jon Sonju (R)
![]() Ron Vandevender and Marc Mulcahy (L)
Ron Vandevender and Marc Mulcahy (L)
![]() Bill Coate and Joni Oja
Bill Coate and Joni Oja
Election Results[edit]
General[edit]
| Governor/Lieutenant Governor of Montana General Election, 2012 | ||||
|---|---|---|---|---|
| Party | Candidate | Vote % | Votes | |
| Democratic | 48.9% | 236,450 | ||
| Republican | Rick Hill and Jon Sonju | 47.3% | 228,879 | |
| Libertarian | Ron Vandevender and Marc Mulcahy | 3.8% | 18,160 | |
| Total Votes | 483,489 | |||
| Election results via Montana Secretary of State | ||||
According to the website Daily Kos, this race was one of nine top-ballot 2012 races that contained Libertarian candidates who received more total votes than the difference between the Democratic winner and the GOP runner-up. In this case, Ron Vandevender took in over 9,000 more votes than the number that separated Bullock and Hill.[2]
Primary[edit]
| Governor/Lt. Governor of Montana, Democratic Primary, 2012 | ||||
|---|---|---|---|---|
| Candidate | Vote % | Votes | ||
| 86.6% | 76,738 | |||
| Heather Margolis & Steve Nelsen | 13.4% | 11,823 | ||
| Total Votes | 88,561 | |||
| Election results via Montana Secretary of State. | ||||
| Governor/Lt. Governor of Montana, Republican Primary, 2012 | ||||
|---|---|---|---|---|
| Candidate | Vote % | Votes | ||
| 34.4% | 46,802 | |||
| Corey Stapleton & Bob Keenan | 18.1% | 24,661 | ||
| Ken Miller & Bill Gallagher | 18% | 24,496 | ||
| Jim O'Hara & Scott Swingley | 12.2% | 16,653 | ||
| Neil Livingstone & Ryan Zinke | 8.8% | 12,038 | ||
| Jim Lynch & Al Olszewski | 6.1% | 8,323 | ||
| Bob Fanning & Joel Boniek | 2.3% | 3,087 | ||
| Total Votes | 136,060 | |||
| Election results via Montana Secretary of State. | ||||
Background[edit]
Key dates[edit]
- Administrative deadlines are at close of business (5:00) unless otherwise noted.
| Deadline | Event |
|---|---|
| Jan. 12 - Mar. 12 | Candidate filing period |
| May 7 | Voter registration for primary election |
| June 4, Noon | Requests received for absentee ballot for primary election |
| June 5 | Primary election |
| Aug. 13 | Deadline for candidates to withdrawal general election candidacy |
| Aug. 23 | Secretary of State certifies candidates on ballot |
| Nov. 5 | Requests received for absentee ballot for general election |
| Nov. 6 | General election |
| Dec. 3 | Official results certified |
Race tracking[edit]
| 2011 Race Rankings - Montana Governor | ||||
|---|---|---|---|---|
| Race Tracker | Race Rating | |||
| The Cook Political Report[3] | Toss-up | |||
| Governing Politics[4] | Lean Republican | |||
| Larry J. Sabato's Crystal Ball[5] | Leans Republican | |||
| Rasmussen Reports Gubernatorial Scorecard[6] | No prediction yet | |||
| The Rothenberg Political Report[7] | Pure Toss-up | |||
| Overall Call | ||||
Candidates[edit]
General election candidates[edit]
![]() Steve Bullock and John E. Walsh (D)
Steve Bullock and John E. Walsh (D)
![]() Rick Hill and Jon Sonju (R)
Rick Hill and Jon Sonju (R)
![]() Ron Vandevender and Marc Mulcahy (L)
Ron Vandevender and Marc Mulcahy (L)
![]() Bill Coate and Joni Oja
Bill Coate and Joni Oja
Primary election candidates[edit]
Despite early speculation, there were a few surprises when the dust had settled after the candidate filing period came to an end on March 12, 2012.
- The Democratic field was initially expected to be a three-person showdown, but state Senator Larry Jent dropped out of the race on March 8, 2012 saying he hadn't raised enough money to compete with Bullock,[8] who, according to early polling, was a heavy favorite with 70% of the primary vote to Jent's 6% (24% of voters were undecided).[9]
- On the Republican side, gubernatorial hopeful Bob Fanning announced in early January his running mate would be Chuck Baldwin.[10] But Baldwin left the campaign in mid-February due to a lack of both money and a "quality organization"[11] and Fanning picked up a new running mate, former state Rep. Joel Boniek.
 Democratic primary candidates[edit]
 Republican primary candidates[edit]
- Bob Fanning & Joel Boniek
- Rick Hill & Jon Sonju

- Neil Livingstone & Ryan Zinke
- Jim Lynch & Al Olszewski
- Ken Miller & Bill Gallagher
- Jim O'Hara & Scott Swingley
- Corey Stapleton & Bob Keenan
Libertarian candidates[edit]
Independent candidates[edit]
Former candidates[edit]
- Larry Jent, a state Senator
- Drew Turiano, a real estate investor and former science fiction author, initially indicated his intention to run for Governor of Montana, but in January 2012 announced he would, instead, seek the Republican nomination for Montana Secretary of State in the 2012 election.[12]
- David Wanzenried, a state Senator, was considering a run for the Democratic nomination
- Jeff Essmann, a state Senator, declared his intent to run, but withdrew from the race before the candidate filing deadline, citing a lack of funds and a desire for a united Republican Party[13]
- Chuck Baldwin appeared to be the lieutenant governor candidate on Bob Fanning's ticket but Fanning filed with Joel Boniek instead.
Endorsements[edit]
Six of the nine gubernatorial candidates provided The Billings Gazette with a list of five individuals, groups or a combination that had endorsed them.[14]
Democrats[edit]
Steve Bullock
- Gov. Brian Schweitzer
- Montana AFL-CIO
- MEA-MFT
- Planned Parenthood
- Montana Conservation Voters
Republicans[edit]
|
Neil Livingstone
|
Corey Stapleton
|
Polls[edit]
General election polls[edit]
Without Coate or Vandevender[edit]
| Governor of Montana | |||||||||||||||||||
|---|---|---|---|---|---|---|---|---|---|---|---|---|---|---|---|---|---|---|---|
| Poll | Steve Bullock | Rick Hill | Undecided | Margin of error | Sample size | ||||||||||||||
| Pharos Research Group (October 26-28, 2012) | 47.1% | 44.4% | 8.5% | +/-3.5 | 799 | ||||||||||||||
| Note: The polls above may not reflect all polls that have been conducted in this race. Those displayed are a random sampling chosen by Ballotpedia staff. If you would like to nominate another poll for inclusion in the table, send an email to editor@ballotpedia.org. | |||||||||||||||||||
With Coate and Vandevender[edit]
| Governor of Montana | |||||||||||||||||||
|---|---|---|---|---|---|---|---|---|---|---|---|---|---|---|---|---|---|---|---|
| Poll | Steve Bullock | Rick Hill | Ron Vandevender | Bill Coate | Undecided | Margin of error | Sample size | ||||||||||||
| Public Policy Polling (October 8-10, 2012) | 42% | 43% | 4% | 4% | 7% | +/-3.6 | 737 | ||||||||||||
| Public Policy Polling (September 10-11, 2012) | 44% | 39% | 4% | 4% | 9% | +/-3.8 | 656 | ||||||||||||
| AVERAGES | 43% | 41% | 4% | 4% | 8% | +/-3.7 | 696.5 | ||||||||||||
| Note: The polls above may not reflect all polls that have been conducted in this race. Those displayed are a random sampling chosen by Ballotpedia staff. If you would like to nominate another poll for inclusion in the table, send an email to editor@ballotpedia.org. | |||||||||||||||||||
With Vandevender[edit]
| Governor of Montana | |||||||||||||||||||
|---|---|---|---|---|---|---|---|---|---|---|---|---|---|---|---|---|---|---|---|
| Poll | Steve Bullock | Rick Hill | Ron Vandevender | Undecided | Margin of error | Sample size | |||||||||||||
| Mason-Dixon Polling and Research ( October 29-31, 2012) | 46% | 49% | 2% | 3% | +/-4.0 | 625 | |||||||||||||
| Mason-Dixon Polling and Research (September 17-19, 2012) | 44% | 43% | 2% | 11% | +/-4.0 | 625 | |||||||||||||
| AVERAGES | 45% | 46% | 2% | 7% | +/-4 | 625 | |||||||||||||
| Note: The polls above may not reflect all polls that have been conducted in this race. Those displayed are a random sampling chosen by Ballotpedia staff. If you would like to nominate another poll for inclusion in the table, send an email to editor@ballotpedia.org. | |||||||||||||||||||
Steve Bullock as Democratic candidate[edit]
| Steve Bullock vs. Jeff Essmann | |||||||||||||||||||
|---|---|---|---|---|---|---|---|---|---|---|---|---|---|---|---|---|---|---|---|
| Poll | Steve Bullock | Jeff Essmann | Undecided | Margin of error | Sample size | ||||||||||||||
| Public Policy Polling (November 28-30, 2011) | 42% | 30% | 28% | +/-2.4 | 1,625 | ||||||||||||||
| Note: The polls above may not reflect all polls that have been conducted in this race. Those displayed are a random sampling chosen by Ballotpedia staff. If you would like to nominate another poll for inclusion in the table, send an email to editor@ballotpedia.org. | |||||||||||||||||||
| Steve Bullock vs. Rick Hill | |||||||||||||||||||
|---|---|---|---|---|---|---|---|---|---|---|---|---|---|---|---|---|---|---|---|
| Poll | Steve Bullock | Rick Hill | Undecided | Margin of error | Sample size | ||||||||||||||
| Public Policy Polling (November 28-30, 2011) | 38% | 39% | 23% | +/-2.4 | 1,625 | ||||||||||||||
| Note: The polls above may not reflect all polls that have been conducted in this race. Those displayed are a random sampling chosen by Ballotpedia staff. If you would like to nominate another poll for inclusion in the table, send an email to editor@ballotpedia.org. | |||||||||||||||||||
| Steve Bullock vs. Neil Livingstone | |||||||||||||||||||
|---|---|---|---|---|---|---|---|---|---|---|---|---|---|---|---|---|---|---|---|
| Poll | Steve Bullock | Neil Livingstone | Undecided | Margin of error | Sample size | ||||||||||||||
| Public Policy Polling (November 28-30, 2011) | 41% | 29% | 30% | +/-2.4 | 1,625 | ||||||||||||||
| Note: The polls above may not reflect all polls that have been conducted in this race. Those displayed are a random sampling chosen by Ballotpedia staff. If you would like to nominate another poll for inclusion in the table, send an email to editor@ballotpedia.org. | |||||||||||||||||||
| Steve Bullock vs. Ken Miller | |||||||||||||||||||
|---|---|---|---|---|---|---|---|---|---|---|---|---|---|---|---|---|---|---|---|
| Poll | Steve Bullock | Ken Miller | Undecided | Margin of error | Sample size | ||||||||||||||
| Public Policy Polling (November 28-30, 2011) | 40% | 31% | 29% | +/-2.4 | 1,625 | ||||||||||||||
| Note: The polls above may not reflect all polls that have been conducted in this race. Those displayed are a random sampling chosen by Ballotpedia staff. If you would like to nominate another poll for inclusion in the table, send an email to editor@ballotpedia.org. | |||||||||||||||||||
Larry Jent as Democratic candidate[edit]
| Larry Jent vs. Jeff Essmann | |||||||||||||||||||
|---|---|---|---|---|---|---|---|---|---|---|---|---|---|---|---|---|---|---|---|
| Poll | Larry Jent | Jeff Essmann | Undecided | Margin of error | Sample size | ||||||||||||||
| Public Policy Polling (November 28-30, 2011) | 26% | 30% | 44% | +/-2.4 | 1,625 | ||||||||||||||
| Note: The polls above may not reflect all polls that have been conducted in this race. Those displayed are a random sampling chosen by Ballotpedia staff. If you would like to nominate another poll for inclusion in the table, send an email to editor@ballotpedia.org. | |||||||||||||||||||
| Larry Jent vs. Rick Hill | |||||||||||||||||||
|---|---|---|---|---|---|---|---|---|---|---|---|---|---|---|---|---|---|---|---|
| Poll | Larry Jent | Rick Hill | Undecided | Margin of error | Sample size | ||||||||||||||
| Public Policy Polling (November 28-30, 2011) | 26% | 39% | 35% | +/-2.4 | 1,625 | ||||||||||||||
| Note: The polls above may not reflect all polls that have been conducted in this race. Those displayed are a random sampling chosen by Ballotpedia staff. If you would like to nominate another poll for inclusion in the table, send an email to editor@ballotpedia.org. | |||||||||||||||||||
| Larry Jent vs. Neil Livingstone | |||||||||||||||||||
|---|---|---|---|---|---|---|---|---|---|---|---|---|---|---|---|---|---|---|---|
| Poll | Larry Jent | Neil Livingstone | Undecided | Margin of error | Sample size | ||||||||||||||
| Public Policy Polling (November 28-30, 2011) | 26% | 30% | 44% | +/-2.4 | 1,625 | ||||||||||||||
| Note: The polls above may not reflect all polls that have been conducted in this race. Those displayed are a random sampling chosen by Ballotpedia staff. If you would like to nominate another poll for inclusion in the table, send an email to editor@ballotpedia.org. | |||||||||||||||||||
| Larry Jent vs. Ken Miller | |||||||||||||||||||
|---|---|---|---|---|---|---|---|---|---|---|---|---|---|---|---|---|---|---|---|
| Poll | Larry Jent | Ken Miller | Undecided | Margin of error | Sample size | ||||||||||||||
| Public Policy Polling (November 28-30, 2011) | 25% | 33% | 42% | +/-2.4 | 1,625 | ||||||||||||||
| Note: The polls above may not reflect all polls that have been conducted in this race. Those displayed are a random sampling chosen by Ballotpedia staff. If you would like to nominate another poll for inclusion in the table, send an email to editor@ballotpedia.org. | |||||||||||||||||||
Debates[edit]
The candidates for governor met several times, though not always as a full field.
Nine candidates; both parties[edit]
On February 27, the Cascade County Farm Bureau hosted a forum featuring eight Republicans and one Democrat, Larry Jent. The candidates discussed issues such as the threat of brucellosis to the state's cattle, combination schools in rural areas, and the Keystone XL pipeline. Each candidate also had the chance to present their case to voters.[15]
GOP candidates[edit]
On May 2, five of the seven Republican gubernatorial candidates met in Whitefish for a debate. Debate topics included lowering property taxes, increasing the use of the state’s natural resources, creating a less adversarial legal and regulatory environment, and identifying new funding sources for public education.[16][17]
At the start of the debate, each candidate was asked to highlight the strengths of their campaign and respond to criticisms that had arisen during the campaign.
- Jim Lynch highlighted his record as Director of the Montana Department of Transportation, where he saved the state $9.7 million by reducing staff and overtime hours.[16] He argued that attitude, rather than taxes and regulations, was hindering growth and said he would stimulate the state's economy by applying similar savings in state government.[17]
- Neil Livingstone, described as having a federal focus, emphasized his experience managing nine-figure companies worldwide as providing him with experience, objectivity, and vision for Montana.[16] He supported drilling, mining, and logging as ways to revitalize Montana’s economy and pledged to establish a legal and regulatory environment conducive to the state’s prosperity.[17]
- Ken Miller pledged to eliminate both the business employment tax and the corporate income tax.[16] He proposed a loser-pay law designed to reduce the number of lawsuits filed in the state and to speed up the issuance of environmental permits. He also said he would seek an amendment to the part of Montana’s constitution that guarantees everyone a clean and healthy environment, citing concerns about broad judicial interpretation.[17]
- Corey Stapleton suggested that delays in developing Montana's oil and coal resources stem from gubernatorial appointments to boards and commissions responsible for oversight.[17] He proposed using revenue from natural resource development to provide $220 million in permanent property tax relief and to fund public education.[16]
- Rick Hill advocated reducing local property taxes and cited Wyoming's use of coal tax revenues to fund public education as a model.[16] He criticized trial lawyers and environmentalists, whom he identified as responsible for a statewide regulatory framework that he said was hindering Montana's economic growth.[17]
Campaign finance[edit]
The Montana Commissioner of Political Practices administers campaign finance law and maintains all records online.
|
Due dates for primary election:
|
Due dates for general election:
|
Candidates[edit]
Steve Bullock[edit]
| Steve Bullock Campaign Finance Reports | |||||||||
|---|---|---|---|---|---|---|---|---|---|
| Report | Date Filed | Beginning Balance | Total Contributions for Reporting Period | Expenditures | Cash on Hand | ||||
| Pre-primary report #1[18] | May 19, 2012 | $394,985.03 | $72,910.01 | $(47,915.10) | $419,979.94 | ||||
| Pre-primary report #2[19] | May 31, 2012 | $419,669.94 | $34,633.00 | $(7,440.44) | $446,862.50 | ||||
| Post-primary report[20] | June 25, 2012 | $446,562.50 | $97,539.12 | $(24,115.81) | $519,985.81 | ||||
| Running totals | |||||||||
| $205,082.13 | $(79,471.35) | ||||||||
Rick Hill[edit]
| Rick Hill Campaign Finance Reports | |||||||||
|---|---|---|---|---|---|---|---|---|---|
| Report | Date Filed | Beginning Balance | Total Contributions for Reporting Period | Expenditures | Cash on Hand | ||||
| Pre-primary report #1[21] | May 20, 2012 | $220,936.86 | $43,894.02 | $(165,182.23) | $99,648.65 | ||||
| Pre-primary report #2[22] | May 31, 2012 | $95,748.65 | $25,497.00 | $(75,529.58) | $45,716.07 | ||||
| Post-primary report[23] | June 25, 2012 | $45,716.07 | $31,258.69 | $(59,808.78) | $17,165.98 | ||||
| Running totals | |||||||||
| $100,649.71 | $(300,520.59) | ||||||||
Ron Vandevender[edit]
| Ron Vandevender Campaign Finance Reports | |||||||||
|---|---|---|---|---|---|---|---|---|---|
| Report | Date Filed | Beginning Balance | Total Contributions for Reporting Period | Expenditures | Cash on Hand | ||||
| Pre-primary report #1[24] | May 21, 2012 | $5.72 | $30.00 | $(25.95) | $9.77 | ||||
| Pre-primary report #2[25] | May 30, 2012 | $9.77 | $41.00 | $(40.95) | $9.82 | ||||
| Post-primary report[26] | June 25, 2012 | $9.82 | $0.00 | $(0.00) | $9.82 | ||||
| Running totals | |||||||||
| $71 | $(66.9) | ||||||||
Campaign media and news[edit]
News[edit]
- Election preview: No challengers for Montana's incumbent state executive officials March 13
- Election preview: No primary challengers for Montana's incumbent state executives June 4
Campaign sites[edit]
|
Democrats: |
Republicans: |
Libertarian:
|
Campaign advertisements[edit]
|
Republican Governors Association
AFSCME MT
|
See also[edit]
External links[edit]
- Official candidate list
- "Internet Archive Wayback Machine copy of montanagovernor2012.com". http://web.archive.org/web/20120226185819/http://montanagovernor2012.com/.
Footnotes[edit]
- ↑ Montana Secretary of State, "Term limits," accessed June 8, 2012
- ↑ Daily Kos, "Libertarians provided the margin for Democrats and at least nine elections," November 15, 2012
- ↑ The Cook Political Report, “Governors: Race Ratings”
- ↑ Governing Politics, “Looking Ahead: The 2011-2012 Gubernatorial Landscape”, December 2, 2010
- ↑ Larry J. Sabato's Crystal Ball', “2011 Governor Ratings”
- ↑ Rasmussen Reports', “Election 2010: Scorecard Ratings”
- ↑ Rothenberg Political Report, “Governor Ratings”
- ↑ KPAX.com, "Democrat Larry Jent drops out of race for governor," March 9, 2012
- ↑ Public Policy Polling, "Republican hill leads Bullock by one for MT-Gov. (page 3)," December 5, 2011
- ↑ Flathead Beacon, "Fanning and Baldwin: In this to win," January 17, 2012
- ↑ KRTV.com, "MT gubernatorial candidate Fanning loses running mate," February 13, 2012
- ↑ Billings Gazette, "Turiano leaves governor's race to run for secretary of state," January 16, 2012
- ↑ KXLH.com, "Essman ends run or Governor of MT," January 27, 2012
- ↑ Billings Gazette, "6 governor candidates list campaign endorsements," May 28, 2012
- ↑ KPAX.com, 9 MT gubernatorial candidates square off in Great Falls," February 28, 2012
- ↑ 16.0 16.1 16.2 16.3 16.4 16.5 KPAX.com, "Montana GOP candidates debate in Whitefish," May 2, 2012
- ↑ 17.0 17.1 17.2 17.3 17.4 17.5 The Missoulian, "5 GOP candidates for Montana governor hold debate," May 2, 2012
- ↑ Candidate Campaign Finance Report: Steve Bullock, "May 19, 2012
- ↑ Candidate Campaign Finance Report: Steve Bullock, May 31, 2012
- ↑ http://applicationengine.mt.gov/getContent?vsId={8D83C7D8-4394-45E6-BC0E-DE0AFCC20364}&impersonate=true&objectStoreName=PROD OBJECT STORE&objectType=document Candidate Campaign Finance Report: Steve Bullock, June 25, 2012
- ↑ Candidate Campaign Finance Report: Rick Hill, May 20, 2012
- ↑ Candidate Campaign Finance Report: Rick Hill, May 31, 2012
- ↑ Candidate Campaign Finance Report: Rick Hill, June 25, 2012
- ↑ Candidate Campaign Finance Report: Rob Vandevender, May 21, 2012
- ↑ Candidate Campaign Finance Report: Rob Vandevender, May 30, 2012
- ↑ Candidate Campaign Finance Report: Rob Vandevender, June 25, 2012

 |
State of Montana Helena (capital) |
|---|---|
| Elections |
What's on my ballot? | Elections in 2026 | How to vote | How to run for office | Ballot measures |
| Government |
Who represents me? | U.S. President | U.S. Congress | Federal courts | State executives | State legislature | State and local courts | Counties | Cities | School districts | Public policy |
Categories: [Gubernatorial elections, 2012] [Lieutenant Governor elections, 2012] [State executive official elections, 2012] [Montana elections, 2012]
↧ Download as ZWI file | Last modified: 03/06/2026 12:47:10 | 23 views
☰ Source: https://ballotpedia.org/Montana_gubernatorial_and_lieutenant_gubernatorial_election,_2012 | License: CC BY-SA 3.0