Average
 From Conservapedia
 The average is the sum of a group of numbers divided by the number of values in the group. For example, the average of 3, 5, and 7 is  .
.
Another term for average is the arithmetic mean.
Contents
Other "measures of central tendency"[edit]
An average takes a set of numbers and replaces it with a single number. The average has these properties:
- If all the numbers in the set are equal, then the average equal to every number in the group. The average of 15, 15, 15, 15, and 15 is 15.
- If the numbers in the set are not equal, the average always falls somewhere within the set. That is, it is higher than the lowest number and lower than the highest number.
Because of these characteristics, an average takes a group of numbers and replaces it with a single number that can be thought of as the center of the group, or as a representative value that can stand for the whole group.
The average is not the only measurement with these characteristics. It is one of a number of measures of central tendency. All of them replace a group of numbers with a single number that falls somewhere within the group.
Because the average is familiar and easily calculated, it is often chosen as the single number that summarizes a group. Depending on how the number is to be used, sometimes the average is a good choice, sometimes it is not, so it is important to understand the other choices.
- The mid-range is the value which falls exactly halfway between the two extreme values in the group.
- The median is the value which splits the group of numbers in the middle: half are higher, half are lower. The median is the most commonly used quantile.
- The mode is the exact value (or values) which occurs the most often in the group; in a continuous distribution, it is the highest peak.
- The average most commonly used is known as the arithmetic mean. There are other means.
- The geometric mean is used for "averaging" compound interest rates and in other percentage-growth situations.
- The harmonic mean is used when averaging speeds that are all measured along the same distance (rather than the same time).
- The root mean square is used in engineering power calculations, and heavily used in statistics in measurements of variance.
- The symbol for a parabolic mean is " (number) ||"
An example of average, median, and mode[edit]
Consider the number of chapters in each of the thirty-nine books of the Old Testament.[1] Ranked in order by number of chapters, the list is:
- 1, 2, 3, 3, 3, 3, 4, 4, 4, 5, 7, 8, 9, 10, 10, 12, 12, 13, 14, 14, 21, 22, 24, 24, 25, 27, 29, 31, 31, 34, 36, 36, 40, 42, 48, 50, 52, 66, 150
- The thirty-nine books contain a total of 929 chapters, so the average number of chapters is 23.8.
- The middle item of the set is the twentieth item, with nineteen items below it and nineteen items above it; the twentieth item is 14, so the median number of chapters is 14.
- There are four books (Joel, Nahum, Habbakuk, and Zephaniah) that are 3 chapters long. The number 3 occurs more times in the list than any other. The mode of the set of numbers is 3.
The list contains many books with a small number of chapters, a few books with a large number of chapters, and one book (Psalms) with a much larger number of chapters than any of the others. This is an example of a "skewed distribution." In skewed distributions, the average and the median can be very different, as they are here. Notice that 22 of the items have values below the average and only 17 have values above it. Thus, 56% of the items have values below the average.
On A Prairie Home Companion, Garrison Keillor jokes about Lake Wobegon where "all the children are above average." It is not actually possible for all of the items in a set to be "above average." However, it is easy to concoct a highly skewed distribution in which 90% of them are. Imagine a circus act with nine clowns and one macaque monkey, and ask "what is the average weight of the performers in the act?" If the clowns weigh about 150 pounds each and the monkey weighs about 10 pounds, then the average weight of the performers is 1360 pounds / 10 performers = 136 pounds. The monkey is below average, and the nine clowns—90% of the performers—are above average.
The average as a "balance point"[edit]
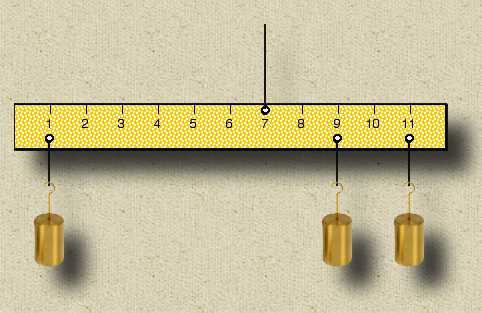
If equal weights are hung from a ruler, and the weight of the ruler itself is small enough to be neglected, the distance marking at which the ruler will balance can be shown to be the average of the distance markings at which the weights are hung.
In this diagram, weights are hung at the 1, 9, and 11 inch marks. The average of 1, 9, and 11 is 7. The ruler will balance if it is hung at the 7 inch mark. This can be considered as an example of an "analog computer" for the average.
When there are two numbers in a set, the average always "splits the difference" between them. For example, the average of 10 and 20 is 15. The two numbers, 10 and 20, are separated by ten units. The average, 15, is five units away from 10 and five units away from 20.
In the weight-and-ruler example, if we look at the distances of the weights to the left and right of the average, we see that
- One weight is 6 inches to the left of the average
- The other weights are 2 and 4 units to the right of the average
The distance of the weight on the left — 6 inches — equals the total of the distances of the weights on the right.
It can be shown that this is always true. The sum of the distances[2] between the average and each of the numbers above it is always equal to the sum of the distances between the average and each of the numbers below it.
Compare this to the median. In the case of the median, the count of the numbers above the median equals the count of the numbers below the median.
Weighted averages[edit]
A weighted average is an average in which some of the items of the group count or weigh more than others.
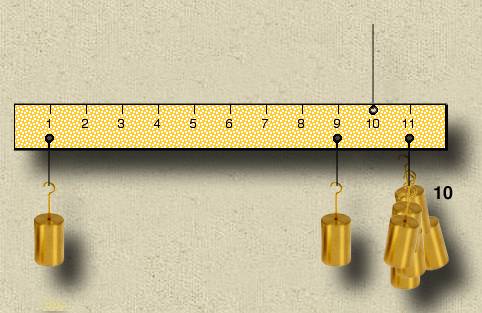
One way to do this is to repeat an item or include it more than one time in the calculation of the average. For example, consider the ruler diagram above. Imagine that we hang ten weights at the 11" mark. Instead of
- (1 + 9 + 11) / 3 = 7,
it is now
- (1 + 9 + 11 + 11 + 11 + 11 + 11 + 11 + 11 + 11 + 11 + 11) / 12 = 10
Giving extra "weight" to one of the items moves the average closer to the items with more weight.
In this case, we put ten weights at the 11" mark and added it in ten times. But we could have hung one heavier weight at the 11" mark. That weight could be 2.5 or 8.6 or 16.184 times as much as the others. When we used ten weights, we could have written the calculation for the average this way:
- (1·1 + 1·9 + 10·11) / (1 + 1 + 10)
When the weights are not integers, we do the calculation the same way. Instead of a sum, we use a weighted sum, in which each item is multiplied by a weighting factor; when we do the division, instead of dividing by the number of items, we divided by the sum of the weights. As an example of a case where a weighted average is appropriate: suppose I gas my car every Monday. Suppose that during one month price of gas is $2.00 per gallon the first week, $2.20 the second week, and $2.40 the third week, and $2.20 the fourth week. A newspaper report might say that the average price of gas for the month is the average of those four numbers:
- ($2.00 + $2.20 + $2.40 + $2.20) / 4 = $2.20.
But the average price of the gas I bought depends on how much gas I buy each week. For me, the average price of gas is the price of gas each week weighted by the amount of gas I actually bought each week.
For example, suppose that I did almost no driving on the first, second, and fourth weeks, and bought only one gallon because (for some reason) I wanted to keep the tank topped up, but that on the third week I was on vacation, took a trip, and used ten gallons. Since I did almost of my driving on the third week, the price of the gas I bought is going to be dominated by that third week. It is going to be close to $2.40 per gallon. If I hadn't bought any gas at all on the first, second, and fourth weeks, the price of gas on those weeks wouldn't have mattered at all. As it is, they don't matter very much.
If I look at the four receipts at the end of the month, I see:
- First week: 1 gallon at $2.00 per gallon, total $2.00
- Second week: 1 gallon at $2.20 per gallon, total $2.20
- Third week: 10 gallons at $2.40 per gallon, total $24.00
- Fourth week: 1 gallon at $2.20 per gallon, total $2.20
At the end of the month, I've spent a total of $30.40 and I've bought a total of 13 gallons of gas, so the average price of the gas I bought is $30.40/13 = $2.34 per gallon:
- (1·2.00 + 1·2.20 + 10·2.40 + 1·2.20) / (1 + 1 + 10 + 1) = 2.34
References[edit]
Categories: [Statistics]
↧ Download as ZWI file | Last modified: 02/22/2023 03:26:16 | 6 views
☰ Source: https://www.conservapedia.com/Average | License: CC BY-SA 3.0
 ZWI signed:

 KSF
KSF