Prefuse
 From Handwiki
 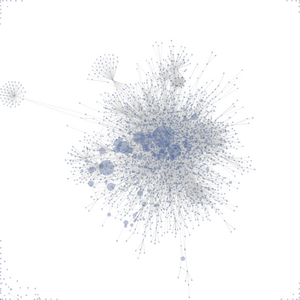 Visualization of a link structure in a wiki, created with Prefuse. Node size represents the amount of activity on the wiki on a given day. | |
| Developer(s) | Jeffrey Heer |
|---|---|
| Written in | Java |
| License | BSD |
| Website | Prefuse.org (Archived) |
Prefuse is a Java-based toolkit for building interactive information visualization applications. It supports a rich set of features for data modeling, visualization and interaction. It provides optimized data structures for tables, graphs, and trees, a host of layout and visual encoding techniques, and support for animation, dynamic queries, integrated search, and database connectivity.
Prefuse uses the Java 2D graphics library, and is easily integrated into Swing applications or Java applets. Prefuse is licensed under the terms of a BSD license, and can be used freely for commercial and non-commercial purposes.
Overview
This section does not cite any external source. HandWiki requires at least one external source. See citing external sources. (May 2011) (Learn how and when to remove this template message) |
Prefuse is a Java-based extensible software framework for creating interactive information visualization applications. It can be used to build standalone applications, visual components and Java applets. Prefuse intends to simplify the processes of visualizing, handling and mapping of data, as well as user interaction.
Some of Prefuse's features include:
- Table, graph, and tree data structures supporting arbitrary data attributes, data indexing, and selection queries, all with an efficient memory footprint.
- Components for layout, color, size, and shape encodings, distortion techniques and more.
- A library of controls for common interactive, direct-manipulation operations.
- Animation support through a general activity scheduling mechanism.
- View transformations supporting panning and zooming, including both geometric and semantic zooming.
- Dynamic queries for interactive filtering of data.
- Integrated text search using a number of available search engines.
- A physical force simulation engine for dynamic layout and animation (s.a. Force-directed graph drawing)
- Flexibility for multiple views, including "overview+detail" and "small multiples" displays.
- A built in, SQL-like expression language for writing queries to prefuse data structures and creating derived data fields.
- Support for issuing queries to SQL databases and mapping query results into prefuse data structures.
(and perhaps most importantly)
- Simple, developer-friendly application programming interfaces (APIs) for creating custom processing, interaction, and rendering components.
Prefuse has been used in school course projects, academic and industrial research, and commercial software development.
Architecture
The design of the prefuse toolkit is based upon the information visualization reference model, a software architecture pattern that breaks up the visualization process into a series of discrete steps. "Prefuse: a toolkit for interactive information visualization" provides more details on implementation and evaluation.[1]
The information visualization reference model was developed in the Ph.D. thesis work of Ed Chi, under the name of the data state model. Chi showed that the framework successfully modeled a wide array of visualization applications. Later, Chi's work showed that the model was functionally equivalent to the data flow model used in existing graphics toolkits such as VTK. In their work, "Readings in Information Visualization: Using Vision to Think", Stuart K. Card, Jock D. Mackinlay, and Ben Shneiderman present their own interpretation of this pattern, dubbing it the "information visualization reference model".[2]
See also
- Rhizome Navigation
References
- ↑ Jeffrey Heer, Stuart K. Card and James A. Landay (2005). " prefuse: a toolkit for interactive information visualization" . In: Proceedings of the SIGCHI conference on Human factors in computing systems: 421-430, Portland, Oregon, USA: ACM.
- ↑ Jock D. Mackinlay Stuart K. Card, Ben Shneiderman (eds.) (1999). Readings in information visualization: using vision to think. Morgan Kaufmann Publishers Inc, p.686.
External links
 |  |
Categories: [Computational science] [Free data visualization software] [Free software programmed in Java (programming language)]
↧ Download as ZWI file | Last modified: 04/06/2024 08:49:46 | 9 views
☰ Source: https://handwiki.org/wiki/Software:Prefuse | License: CC BY-SA 3.0