Race And Ethnicity In Censuses
 From Handwiki
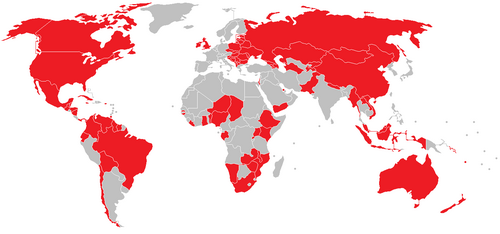
Many countries and national censuses currently enumerate or have previously enumerated their populations by race, ethnicity, nationality, or a combination of these characteristics.[1][2] Different countries have different classifications and census options for race and ethnicity/nationality which are not comparable with data from other countries.[1][3] In addition, many of the race and ethnicity concepts that appear on national censuses worldwide have their origins in Europe or in the views of Europeans, rather than in the views of the locals of these countries.[4]
Africa
Angola
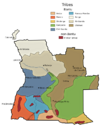
The Portuguese asked about race in colonial censuses when they controlled Angola, and they provided three options: White, Mestizo, or African/Black. Africans had to then pick either "Assimilado" (assimilated) or "Indigenato" (indigenous).[5] Angola has not used any racial categories since its independence in 1975.[5] Tribe and language for Africans were recorded only in 1950 and 1960.[5]
Benin
The people in Benin were enumerated by ethnicity in 1979, 1992, and 2013 but not in 2002.[6]
Botswana
Botswana enumerated people by race in all censuses between 1904 and 1946, and again in the 1964 census (though not in 1956), but in no censuses after 1964.[7] People were enumerated by language use in 1946 and 1956 and again in 2001 and 2011.[7]
Cape Verde
Cape Verde enumerated its population by ethnicity in 1950.[6]
Central African Republic
The Central African Republic enumerated its population by ethnicity in 1959/1960.[6]
Chad
Chad enumerated people by ethnicity in 1993 and 2009.[6]
Democratic Republic of Congo
The people in the Democratic Republic of Congo were enumerated by ethnicity from 1955 to 1958.[6]
Republic of Congo
The people in the Republic of Congo were enumerated by ethnicity in 1960, 1974, and 1984.[6]
Equatorial Guinea
The population of Equatorial Guinea was enumerated by ethnicity in 1950.[6]
Ethiopia
Ethiopia enumerated people by ethnicity in 1994 and in 2007.[6]
Gabon
The population of Gabon was enumerated by ethnicity in 1960–1961 and 1993.[6]
Ghana
The population of Ghana was enumerated by ethnicity in 1960, 2000,[6] and 2010.[8]
Guinea
The population of Guinea was enumerated by ethnicity in 1955.[6]
Guinea-Bissau
The population of Guinea-Bissau was enumerated by ethnicity in 1950 and in 2009.[6]
Ivory Coast
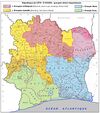
The people of Ivory Coast were enumerated by ethnicity in 1948, 1957–1958, and 1988.[6] The ethnicity data from 1957 to 1958 was only for the rural areas of the country, though.[6]
Kenya
Since 1945, Kenya enumerated people by ethnicity from 1948 all the way up to its most recent census in 2009 (however, the 1999 census ethnicity figures were not made public).[6][9][10][11][12][13] There were some concerns about asking an ethnicity equation in the 2009 census since it came just a year after the disputed Kenyan presidential election of 2007 and the riots that followed it, but Kenya went through with asking about ethnicity in 2009 anyway.[14][15]
The number of ethnic categories and sub-categories recorded in the country's census has changed significantly over time, expanding from 42 in 1969 to more than 120 in 2019.[16]
Lesotho
People in Lesotho were enumerated by race between 1904 and 1976, but not after 1976.[17] Language was only recorded in 1946 and 1956, tribe and language for Africans were recorded only in 1950 and 1960.[17]
Malawi
People in Malawi were enumerated by race between 1911 and 1987, and again in 2018.[18] They were enumerated by language only in 1966, 1998, and 2008.[18] They were enumerated by tribal affiliation only in 1926, 1945, and 2008.[18]
Mali
Mali enumerated people in some parts of the country by ethnicity in 1950.[6]
Mauritius
Mauritius enumerated its population by ethnicity in 1952, 1962, and 1972.[6]
Morocco

Morocco enumerated people by ethnicity in 1950 and 1971.[6] The 2014 census enumerated people by nationality.[19]
Mozambique
People in Mozambique were counted by race only in 1894, 1970, 1997, 2007, and 2017.[20] The race categories in Mozambique were the same ones as in Angola, due to both being controlled by Portugal before acquiring their independence.[20] People were counted by language in all censuses since 1940.[20]
Namibia
People in Namibia were enumerated by race in all 20th century censuses but not in the 2001 census. They were enumerated by language in all censuses since 1951.[21]
Niger
Niger enumerated people by ethnicity in 1959/1960 and 2001.[6]
Nigeria

Nigeria enumerated people by ethnicity in 1963.[6] In addition, Nigeria has announced plans to enumerate its population by ethnicity in its 2016 census.[22]
Rwanda
Rwanda enumerated people by ethnicity from 1933/34 until 1991.[6][23] Due to the 1994 Rwandan Genocide and the ethnic hatred and tensions that caused it, the Rwandan census of 2002 did not enumerate people by ethnicity.[24]
São Tomé and Príncipe
São Tomé and Príncipe enumerated its population by ethnicity in 1950 and 1960.[6]
Senegal
The people of Senegal were enumerated by ethnicity in 1960–1961, 1988, and 2002.[6]
Seychelles
The people of the Seychelles were enumerated by ethnicity in 1947, 1987, and 1994.[6]
Somalia
In the pre-independence period in Somalia, the colonial administrations in British Somaliland and Italian Somaliland officially classified the ethnic Somali majority within the two territories as "Hamitic".[25][26] The Italian Somaliland census of 1935 reported that the remaining 6.2% of the area's population consisted of "Negroid groups", including the Bantu ethnic minorities inhabiting the southern riverine region.[27] These census designations were at the time pre-assigned rather than based on self-reporting. Following independence in 1960, no official census was taken until 1975. This first post-independence national census only collected information on district of birth.[28] However, the general government literature maintained that the country's ethnic Somali majority was of Hamitic stock, or alternately of Arab heritage.[29] Similarly, Article 3 of the Provision Constitution adopted in 2012 indicates that Somalia is an Arab nation.[30] In 2014, the Ministry of Planning and International Cooperation also announced that it would release a new national population census before 2016.[31]
South Africa

South Africa has enumerated people by race in all of its censuses since 1904.[32] Five population group options are provided in response to the question "How would (name) describe him/herself in terms of population group?": "Black African", "Coloured", "Indian or Asian", "White" and "Other".[33] South Africa has also asked about language use since 1921 for white South Africans and since 1936 for all races.[32]
Sudan
Sudan enumerated people by ethnicity in 1956.[6]
Swaziland
The Swazi census counted people by race in all censuses between 1904 and 1976.[34] People were counted by ethnic group and tribe only in 1966 and 1976.[34]
Tanzania
The Tanzanian census enumerated people by race from colonial times until 1967, by ethnicity and tribe from colonial times until 1973. It enumerated people by language only in 1952 and 1958.[35]
Togo
The people in Togo were enumerated by ethnicity in 1948, 1958–1960, and 1970.[6]
Tunisia
Tunisia enumerated people by ethnicity in 1956.[6]
Uganda
The people of Uganda were enumerated by ethnicity from 1948 all the way up to Uganda's most recent census in 2012,[6][36] with the exception of 1980 and possibly 1969.[37]
Zambia
People in Zambia were not continuously counted by race before independence, and when they were counted by race it were primarily the non-Africans/non-blacks who were counted.[38] People were counted by language only in 1931, while they were counted for ethnicity at various points since 1969.[38] The 1969 census asked about language but not ethnic group, and the 1974 census asked about ethnic group, but not language. The 1980 census asked about ethnic group, mother tongue, and language of most frequent use, while the 1990 census asked about ethnic group and mother tongue. The 2000 census asked about ethnic group, language of most frequent use, and second language.[38]
Zimbabwe
People in Zimbabwe were enumerated by race between 1901 and 2012, but many censuses were done separately for Whites/Europeans and Blacks/Africans before the 1970s.[39] People were enumerated by language only in 1982 (when they were enumerated by "[their] father's dialect").[39]
Asia
Abkhazia
People in Abkhazia (when it was still a part of the Russian Empire) were enumerated by native tongue in the 1897 Russian Empire Census.[40][41] In addition to the Soviet Union enumerating people by ethnicity for its entire existence,[42] the partially recognized state of Abkhazia also enumerated people by ethnicity in its post-Soviet censuses of 2003[43] and 2011.[44]
Afghanistan
Prior to 2010, Afghanistan had not held a census since 1979 due to the wars and conflicts that have occurred there over those three decades (since the Soviet invasion of Afghanistan in 1979).[45]
Armenia
People in Armenia (when it was still a part of the Russian Empire) were enumerated by native tongue in the 1897 Russian Empire Census.[40][41] In addition to the Soviet Union enumerating people by ethnicity for its entire existence,[42] Armenia also enumerated people by ethnicity in its post-Soviet censuses of 2001[46] and 2011.[47]
Azerbaijan
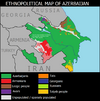
People in Azerbaijan (when it was still a part of the Russian Empire) were enumerated by native tongue in the 1897 Russian Empire Census.[40][41] In addition to the Soviet Union enumerating people by ethnicity for its entire existence,[42] Azerbaijan also enumerated people by ethnicity in its post-Soviet censuses of 1999[48] and 2009.[49]
Bahrain
Bahrain enumerated people by ethnicity in 1965[6] and 2010.[50] The 2010 Bahrain census also enumerated people by their religious beliefs.[50]
Bangladesh
British India (which Bangladesh was a part of) enumerated its population by race between 1872 and 1941.[51]
Brunei
Since 1945, Brunei enumerated people by ethnicity in all censuses since 1947.[6][52]
Burma
The people in Burma (also known as Myanmar) were enumerated by ethnicity in 1931,[53] and 1953.[6] A new census which plans to enumerate the people of Burma by ethnicity and race is planned to be held in 2014.[53][54] The 1931 Burmese census generated a lot of anger from non-Burmese ethnic groups who were marked as Burmese on the census.[53] There is hope that the scheduled 2014 Burma Census will help empower the various ethnic groups in Burma.[54]
China

The People's Republic of China counted people by ethnicity since at least 1952 but does not count people by mother tongue.[55]
Cyprus
The people of Cyprus were enumerated by ethnicity in 1960.[6]
East Timor
East Timor enumerated its population by ethnicity in 1950.[6]
Georgia
People in Georgia (when it was still a part of the Russian Empire) were enumerated by native tongue in the 1897 Russian Empire Census.[40][41] In addition to the Soviet Union enumerating people by ethnicity for its entire existence,[42] Georgia also enumerated people by ethnicity in both post-Soviet censuses in 2002 and 2014.[56]
India
When it was a British colony, India enumerated its population by race between 1872 and 1941.[51]
Indonesia
Indonesia enumerated people by ethnicity in 1930, 2000, and 2010 but not in any other censuses.[57]
Israel
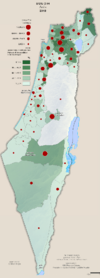
The census in Israel directly asked people about their ethnicity only in 1983.[6] However, Israel has used the religion question on its census to determine the ethnic composition of its population from 1948 to the present day.[58][59] Israel has enumerated its Jewish population by their continent of birth since 1948.[60]
Kazakhstan

People in Kazakhstan (when it was still a part of the Russian Empire) were enumerated by native tongue in the 1897 Russian Empire Census.[40][41] In addition to the Soviet Union enumerating people by ethnicity for its entire existence,[42] Kazakhstan also enumerated people by ethnicity in its post-Soviet censuses of 1999[61] and 2009.[62]
Kyrgyzstan
People in Kyrgyzstan (when it was still a part of the Russian Empire) were enumerated by native tongue in the 1897 Russian Empire Census.[40][41] In addition to the Soviet Union enumerating people by ethnicity for its entire existence,[42] Kyrgyzstan also enumerated people by ethnicity in its post-Soviet censuses of 1999[63] and 2009.[64][65]
Malaysia
People in Malaysia were enumerated by ethnicity/race from 1871 to the present day.[66]
Mongolia
Mongolia enumerated people by ethnicity in 1963 and 2000.[6]
Nagorno-Karabakh

People in Nagorno-Karabakh (when it was still a part of the Russian Empire) were enumerated by native tongue in the 1897 Russian Empire Census.[40][41] In addition to the Soviet Union enumerating people by ethnicity for its entire existence,[42] the de facto independent state of Nagorno-Karabakh also enumerated people by ethnicity in its only post-Soviet census of 2005.[67]
Nepal

Nepal enumerated people by ethnicity in 1991 and 2001.[6]
Pakistan
British India (which Pakistan was a part of) enumerated its population by race between 1872 and 1941.[51]
Palestine
The population in the Palestinian territories was enumerated by ethnicity in 1997.[6]
Philippines
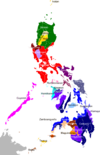
The Philippines enumerated their population by ethnicity in 1948, 1970,[6] 2000, and 2010.
Russia/Soviet Union

The Russian Empire began counting people by native tongue with its first modern census in 1897.[40] In 1920, the Soviet Union replaced this question with a question about ethnicity.[68] The Soviet government organized lists of ethnicities and wanted to shape these various ethnic groups in the mold of Communism.[69] In the words of Soviet politician Anastas Mikoyan, the Soviet Union was "creating and organising new nations"[69] The government of the U.S.S.R. was eager to get ethnic data for many ethnic groups in order to create republics and autonomous regions for many of these ethnic groups and nationalities, and later on (under Joseph Stalin ) in order to deport some of them.[70][71] The Bolsheviks also wanted to get more support from ethnic minority groups within the Soviet Union, many of whom were previously oppressed under Tsarist rule.[71] The Soviet Union continued to ask about ethnicity for the rest of its existence, and Russia also asked about ethnicity in its two post-Soviet censuses of 2002 and 2010.[72] Unlike in 1989, the 2002 census did not require respondents to prove their ethnicity/nationality when they responded to this question.[73] The number of ethnicity/nationality options available on Soviet censuses was enormous—the Soviet Union offered 194 different choices for ethnicity/nationality in its 1926 census.[74] There were 97 options in 1939, 126 options in 1959, 122 options in 1970, 123 options in 1979, and 128 options for the Soviet Union in 1989.[74] There were 192 ethnicity/nationality options for Russia in 2002.[74]
Singapore
The people in Singapore were numerated by ethnicity from at least 1947 up to the most recent Singaporean census in 2010.[6][75]
Sri Lanka
This article's factual accuracy is disputed. (November 2019) (Learn how and when to remove this template message) |
Sri Lanka enumerated its population by ethnicity in 1971, 1981, and 2012.[6]
Tajikistan

People in Tajikistan (when it was still a part of the Russian Empire) were enumerated by native tongue in the 1897 Russian Empire Census.[40][41] In addition to the Soviet Union enumerating people by ethnicity for its entire existence,[42] Tajikistan also enumerated people by ethnicity in its post-Soviet censuses in 2000 and 2010.[76]
Thailand
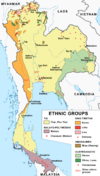
Thailand enumerated people by ethnicity in 1947.[6]
Turkey
Between 1881 and 1893 the Ottoman Empire implemented its first census, which enumerated the people in the empire by ethnicity.[77][78] Some other censuses and studies were conducted in the Ottoman Empire for enumerating the population by ethnicity after the first Ottoman census.[77][78]
Turkmenistan
People in Turkmenistan (when it was still a part of the Russian Empire) were enumerated by native tongue in the 1897 Russian Empire Census.[40][41] In addition to the Soviet Union enumerating people by ethnicity for its entire existence,[42] Turkmenistan also enumerated people by ethnicity in its only post-Soviet census in 1995.[79]
Uzbekistan
People in Uzbekistan (when it was still a part of the Russian Empire) were enumerated by native tongue in the 1897 Russian Empire Census.[40][41] The Soviet Union (to which Uzbekistan also belonged) enumerated people by ethnicity for its entire existence.[42] Uzbekistan has not conducted any censuses at all since 1989.[80]
Vietnam
Communist North Vietnam enumerated people by ethnicity in 1960, when Vietnam was still divided into two countries.[81] After Vietnamese reunification, Vietnam enumerated its population by ethnicity from 1979 up to the most recent census in 2019.[81][82][83]
Yemen
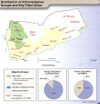
Yemen enumerated its population by ethnicity in 1994.[6] The British Colony of Aden (which is within Yemen's current borders) enumerated its population by ethnicity in 1946 and 1955.[6]
Europe
Albania
Albania enumerated people by ethnicity in 1955,[6] 1989,[84] and 2011.[85][86] The 2011 Albanian census also enumerated people by language used and by their religious beliefs.[85][86]
Belarus

People in Belarus (when it was still a part of the Russian Empire) were enumerated by native tongue in the 1897 Russian Empire Census.[40][41] In addition to the Soviet Union enumerating people by ethnicity for its entire existence,[42] Belarus also enumerated people by ethnicity in its post-Soviet censuses of 1999[87] and 2009.[88]
Bosnia and Herzegovina

The population of Bosnia and Herzegovina has been enumerated by ethnicity since at least 1885, including the recent censuses in 1991 and 2013.[89][90]
Bulgaria

Bulgaria enumerated people by mother tongue in 1880 and 1887 and used this info to determine their ethnicities.[91] Bulgaria directly enumerated people by ethnicity from 1900 all the way up to its most recent census in 2011, with the exception of the 1985 census.[92]
Croatia

The people of Croatia have been enumerated by ethnicity/nationality from at least 1953, including the censuses of 2001 and 2011.[6][93][94]
Czech Republic
Czechoslovakia (of which the territory of the Czech Republic was a part) enumerated people by ethnicity in 1921 and 1930, and the Czech Republic did the same thing from 1991 to the present day.[95]
Estonia
People in Estonia were enumerated by ethnicity/nationality from 1922 to the present day.[96][97][98] People in Estonia were also enumerated by native tongue in the 1897 Russian Empire Census.[40][41] During this time period Estonia was under the control of the Russian Empire, then independent, then (excluding World War II) under the control of the Soviet Union, and then independent again since 1991.[99] There were 192 different ethnicity/nationality options in the 2011 Estonian census.[100]
Finland
Finland has enumerated its population by language of most frequent use from at least 1990 to the present day.[101]
France
France has not counted individuals by race or ethnicity since at least 1978, when a law was passed that prevented individuals from being enumerated by these categories without their consent or a state committee waiver.[102][103] The reasons for this are that many French people consider asking people about race and ethnicity to be a contradiction of their principle of equality and equal treatment for all French people.[42] Also, there is a desire to avoid repeating what Vichy France did in regards to its Jewish population and to prevent the National Front from getting more popularity.[42][102] Former French President Nicolas Sarkozy and his administration supported and proposed counting French people by race and ethnicity.[104] Due to criticism, however, this proposal was never implemented, and as of 2013 former French President Francois Hollande opposes enumerating people by race and ethnicity.[105]
Germany
Nazi Germany enumerated its citizens of Jewish descent in 1939 based on the percent of Jewish ancestry that they had.[106]
Hungary

Hungary enumerated people by ethnicity in 1880, between 1900 and 1941,[107][108] and again from 1980 to the present day[6]
Ireland
The 2002 Irish census enumerated people by their place of birth and their country of citizenship.[109] Ireland introduced an ethnicity question to its census in 2006. The 2011 Irish census enumerated people by ethnicity as well, and offered the options White Irish, White Irish Traveller, Other White, Black or Black Irish (with options for African and Other Black), Asian or Asian Irish (with options for Chinese and Other Asian), Other, and Not Stated.[110]
Italy
Censuses in Italy do not inquire about race or ethnicity. Only information disposable are those of civil registers, where only the country of birth is noted down.[citation needed]
Kosovo
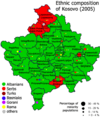
The population of Kosovo was enumerated by ethnicity from 1990s all the way up to the present day.[111][112]
Latvia
.svg.png)
People in Latvia (when it was still a part of the Russian Empire) were enumerated by native tongue in the 1897 Russian Empire Census.[40][41] Latvia enumerated people by ethnicity between 1920 and 1935.[113] The Soviet Union occupied Latvia in 1940, and it enumerated people there by ethnicity from 1959 to 1989.[42] Latvia also enumerated people by ethnicity in its post-Soviet censuses of 2000[114] and 2011.[115]
Lithuania
People in Lithuania (when it was still a part of the Russian Empire) were enumerated by native tongue in the 1897 Russian Empire Census.[40][41] Lithuania enumerated people by ethnicity in its 1923 census and in its 1925 census of its Klaipeda region.[116] The Soviet Union occupied Lithuania in 1940, and it enumerated people there by ethnicity from 1959 to 1989.[42] Lithuania also enumerated people by ethnicity in its post-Soviet censuses of 2001[117] and 2011.[118]
Luxembourg
It is illegal to collect statistics about the race, ethnicity, religion or ancestry of Luxembourg citizens.[citation needed]
Moldova
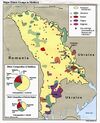
People in Moldova (when it was still a part of the Russian Empire) were enumerated by native tongue in the 1897 Russian Empire Census.[40][41] In addition to the Soviet Union enumerating people by ethnicity for its entire existence,[42] Moldova also enumerated people by ethnicity in both its post-Soviet censuses: in 2004,[119] and 2014.[120]
Monaco
Monaco enumerated people by ethnicity in 1982.[6]
Montenegro

The population of Montenegro was enumerated by ethnicity from 1909 up to its most recent census in 2011.[121][122][123]
North Macedonia

People in North Macedonia were enumerated by ethnicity/nationality from at least 1921 all the way up to the present day.[124] In the most recent census in 2002, 64.2% of the population declared themselves to be ethnic Macedonians. The second-largest ethnic group in the country was the ethnic Albanians with 25.2%. Other major ethnic groups were Turks (3.9%), Romani (2.7%), and Serbs (1.8%).[125]
Norway
Norway enumerated the population in the northern part of the country by ethnicity between 1845 and 1930.[126] In the census of 1970, in limited areas in Northern Norway, people were identified by ethnicity and language. Such information has not been included in any census since then.[127]
Poland
People in Poland (when the country was still occupied by the Russian Empire) were enumerated allegedly by their native tongue in the 1897 Russian Empire Census.[40][41] Sovereign Poland enumerated people by ethnicity/nationality in 1921.[128] It enumerated people by mother tongue in 1931, and used this data to determine ethnicity/nationality.[129] After World War II, the Communist Polish government did not enumerate people by nationality/ethnicity.[129] The post-Communist 2002 Polish census did enumerate people by nationality/ethnicity and language used at home.[129]
Portugal
Census in Portugal do not include a question regarding individuals ethnic or racial background. A question of this kind was recommended to be included for the first time for the 2021 census ("Censos 2021"),[130] which sparked some controversy. The question was ultimately not included, although a question about religion was included.[131] A questionnaire regarding ethnicity was planned by the Instituto Nacional de Estatística for late 2021.[132]
Romania

Romania enumerated people by ethnicity in 1859–1860,[133] 1887,[134] 1899,[135] and in every census since 1930, with the exception of the 1948 census, which enumerated people only by mother tongue.[136][137][138][139] The World Jewish Congress also carried out a census of Romania's Jewish population in 1947.[140]
Serbia
.png)
In addition to Yugoslavia enumerating people by ethnicity/nationality, Serbia enumerated people by ethnicity/nationality in its 2002 and 2011 censuses.[141][142]
Slovakia
The population of Slovakia was enumerated by ethnicity/nationality since 1910 all the way up to the present day.[143][144][145]
Slovenia
The population of Slovenia was enumerated by ethnicity since 1953 all the way up to the present day.[146]
Transnistria
People in Transnistria (when it was still a part of the Russian Empire) were enumerated by native tongue in the 1897 Russian Empire Census.[40][41] In addition to the Soviet Union enumerating people by ethnicity for its entire existence,[42] the de facto independent country of Transnistria also enumerated people by ethnicity in its post-Soviet censuses in 2004 and 2015.[147] Romania also enumerated people in Transnistria by ethnicity in its 1941 census.[148]
Ukraine

People in Ukraine (when it was still a part of the Russian Empire) were enumerated by native tongue in the 1897 Russian Empire Census.[40][41] In addition to the Soviet Union enumerating people by ethnicity for its entire existence,[42] Ukraine also enumerated people by ethnicity in its only post-Soviet census in 2001.[149]
United Kingdom
The United Kingdom began counting people by ethnicity in 1991.[150] There eventually became more of an interest in enumerating ethnic minorities after large-scale racial minority immigration to the United Kingdom began in the post-World War II era.[151] The United Kingdom previously planned to enumerate people by ethnicity in 1981, but changed its mind after the large non-response rate to this question in the 1979 Test Census. In 1979, many ethnic minorities refused to answer this question due to the fear of deportation.[152] In the 2011 census, the ethnic group options for England and Wales were White, Mixed, Asian British, Black British, Chinese or other ethnic group, and Not stated, with ethnic origin sub-group choices for most of these.[153] The census in the United Kingdom also included a question on country of citizenship between 1851 and 1961.[4]
Vatican City
Vatican City enumerated people by ethnicity in 1948.[6]
North America
Bahamas
The population of the Bahamas was enumerated by ethnicity in 1953 and again in 2010.[6]
Barbados
The population of Barbados was enumerated by ethnicity in 1946, 1960, 1970, and 1980.[6]
Belize
Back when Belize was British Honduras, it enumerated people by ethnicity in 1946. Since gaining independence, Belize has enumerated people by ethnicity from 1980 all the way up to its most recent census in 2010.
Bermuda
The people of Bermuda were enumerated by ethnicity since at least 1950 all the way up to the present day.[6][154]
Canada
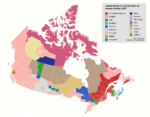
Canada counted people by ethnic origin in 1765 and again from at least 1871 to 2006, with the exception of 1891.[155][156][157][158] The options for ethnicity in the 2006 Canadian census were various kinds of European Canadian, Aboriginal Canadian, and various non-white or non-European groups known officially as "visible minorities".[156] The 2011 Canadian census did not ask about race and ethnicity,[159] but the new voluntary National Household Survey (NHS) for that year did ask about race and ethnicity (as well as many other questions that were previously asked on the Canadian census).[160] Prior to the 1981 Canadian census, respondents could only mark one ethnicity/ethnic ancestry, but the 1981 census and all future ones allowed multiple ethnicity responses.[157] Canada also enumerated its population by place of birth from 1871 to the present day.[161][162]
Costa Rica
Costa Rica enumerated people by ethnicity in 1950.[6]
Cuba
Cuba enumerated people by race since 1774 to the most recent official census in 2012.[163][164]
Dominica
The people in Dominica were enumerated by ethnicity in 1960 and 1981.[6]
Dominican Republic
The people in the Dominican Republic were enumerated by ethnicity in 1950.[6]
Grenada
The people of Grenada were enumerated by ethnicity in 1960 and 1981.[6]
Guatemala
Guatemala has enumerated people by ethnicity in 1950, 1964, 2002, and 2018.[6]
Jamaica
The population of Jamaica was enumerated by ethnicity in 1960 and again from 1982 all the way up to the present day.[6][165][166]
Mexico
Mexico enumerates people on whether or not they speak Spanish or indigenous languages.[167] Mexico does not enumerate its population by race and ethnicity directly.[167]
Panama
Panama has enumerated people by ethnicity from the 1970 census all the way up to its most recent census in 2010.[6][168] People in the then-United States-controlled Panama Canal Zone were numerated by ethnicity in 1950 and 1960.[6]
Puerto Rico
Puerto Rico enumerated people by race in its census since at least 1877 with the exception of the period from 1960 to 1990.
United States
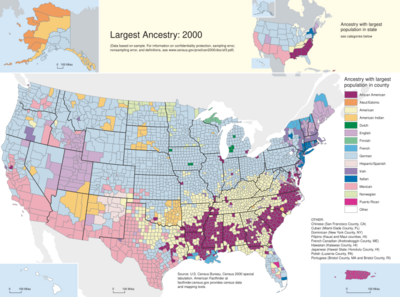
Before the U.S. acquired independence from Great Britain, many of the Thirteen Colonies conducted censuses of their own where they enumerated their populations by race.[169][170] The United States as a whole enumerated people by race in every census since its first census in 1790.[171] Part of the reason why the United States began counting people by race much sooner than many other countries was due to the Three Fifths Compromise, which determined the amount of representation that Southern states had based on how many slaves they had (slaves were counted as three-fifths of a person for representation purposes, and a new census every ten years was needed to enumerate the current slave population).[172] Initially, the United States Census only counted Americans as either white or black, with blacks classified as either free or slaves until 1860 (slavery in the United States was abolished in 1865).[173] Over time, the United States has also added some other racial categories as well.[173] Asian and Native American categories were added in 1860.[173] However, the first census to enumerate all Native Americans occurred in 1890.[173] Before that point Native Americans living on reservations were not counted, and thus most Native Americans in the U.S. were not counted in census data before 1890.[173] Between 1850 and 1870, and in 1890, 1910, and 1920, the U.S. Census Bureau also enumerated Mulattoes and sometimes other partially black groups (Quadroons and Octoroons) separately.[173]
The U.S. Census Bureau counted Mexicans as a separate race in 1930[174] and tried to retroactively determine the number of Mexicans in the U.S. in 1910 and 1920 as well.[173]
President Franklin D. Roosevelt promoted a "good neighbor" policy that sought better relations with Mexico. In 1935, a federal judge ruled that three Mexican immigrants were ineligible for citizenship because they were not white, as required by federal law. Mexico protested, and Roosevelt decided to circumvent the decision and make sure the federal government treated Hispanics as white. The State Department, the Census Bureau, the Labor Department, and other government agencies therefore made sure to uniformly classify people of Mexican descent as white. This policy encouraged the League of United Latin American Citizens in its quest to minimize discrimination by asserting their whiteness.[175]
Hispanics were counted as whites in 1940, but for the first time ever, the U.S. made an attempt to measure the size of the Hispanic population that year.[173] The U.S. resumed enumerating its Hispanic/Latino population in 1970, with Hispanics being enumerated in every U.S. census since then.[173] The U.S. Census Bureau also began offering Hispanics several sub-group options from which they could identify themselves, such as Mexican, Puerto Rican, Cuban, et cetera (these Hispanic sub-group options have changed over time).[176][177] The Other race category was added in 1950, and in 2000 multi-race responses were tabulated for the first time (instructions now explicitly inform respondents that they can choose multiple race boxes).[173] Because multiracial respondents are now allowed, U.S. Census data since 2000 is not directly comparable with that of previous censuses.[173] While people nowadays are enumerated by race based on self-identification, until 1950 their race on the census was mainly determined by their census enumerator.[173] During this time multiracial people who were White and of another race were usually marked down as belonging to the other race due to the One drop rule.[173] The instructions provided to enumerators endorsed this practice.
It is worth noting that some of the definitions of race in the United States changed over time. For instance, Indian Americans were previously marked as Hindu in 1920–1940, Other race in 1950–1960, and White in 1970 before being marked as Asian (Indian) since 1980.[173] The U.S. census counted certain Asian ethnic groups separately since 1870, initially counting only Chinese and Japanese, but having other categories as well since 1910.[173] It only began counting all people by ethnic ancestry since the 1980 census, though.[178] In addition to a Hispanic/Latino ethnicity question that has appeared on the census short form since 1980 (based on the US Office of Management and Budget's official categories specified in 1977). In addition, at various times the Census Bureau has also used an ancestry question. Before 1970, Alaska and Hawaii had different choices for race on their censuses in contrast to the continental United States.[173]
The United States has also used language as a way to classify people by race or ethnicity.[179] From 1910 to 1940, the Census recorded the mother tongue of the foreign-born population and their children.[180] In 1960 and 1970 the Census Bureau also used mother tongue to classify respondents by ethnicity, but the definition of mother tongue was not consistent. Since 1980, the Census Bureau has tabulated language spoken at home for people aged five or older.[181]
The 2020 United States Census might allow Middle Easterners and North Africans to write in their ethnicity/race instead of merely marking them as White.[182][183] Right now, and in the past, Arabs have been marked in the U.S. Census as White.[182] This began in the early twentieth century when Arabs coming to the United States successfully petitioned to be marked as White in order to avoid entry quotas and have a greater chance of achieving success and avoiding discrimination.[182][184]
The United States is one of the countries that uses racial and ethnic census data in order to create minority-majority districts, as is required by the 1965 Voting Rights Act.[185] These districts were created in order to increase minority representation in the United States Congress following the end of legal segregation and racial discrimination in the Southern United States.[185]
Since 1850, the United States enumerated its population by their country of birth of its population.[186] The whole U.S. population was enumerated by country of birth between 1850 and 1930 and again from 1960 to the present day.[186] Meanwhile, only the White population of the United States was enumerated by their country of birth in 1940 and 1950.[186]
Oceania
Australia
Australia enumerated its population by race between 1911 and 1966, by racial origin in 1971 and 1976, by ethnic origin in 1981, and by ancestry since 1986.[187]
Fiji
The population of Fiji was enumerated by ethnicity from 1881 all the way up to Fiji's most recent census in 2007.[188]
Nauru
The population of Nauru was enumerated by ethnicity between 1947 and 1977.[6]
New Zealand

New Zealand enumerated people by ethnicity from 1858 to the present day.[189] People were enumerated by tribal affiliation in 1901 and again from 1991 to the present day.[189]
Palau
Palau enumerated people by ethnicity in 1995.[6]
Papua New Guinea
Papua New Guinea only enumerated its population by ethnicity in 1971.[6]
South America
Argentina
Argentina enumerated its population by their country of birth from 1869 to the present day.[190]
Bolivia

Bolivia enumerated people by ethnicity in 1950,[6] 2001,[191] and 2012.[6][192] The 2012 census included 40 ethnic group options.[192] However, it did not include Mestizo as an option, which critics of current Bolivian President Evo Morales say was because he wants more Bolivians to identify as one of the indigenous groups in order to lend more legitimacy to his indigenous-friendly policies.[192]
| Ethnic group | Total people | Male | Female |
|---|---|---|---|
| Afroboliviano | 16.329 | 8.785 | 7.544 |
| Araona | 910 | 452 | 458 |
| Aymara | 1.191.352 | 592.817 | 598.535 |
| Ayoreo | 1.862 | 954 | 908 |
| Baure | 2.319 | 1.219 | 1.100 |
| Canichana | 617 | 360 | 257 |
| Cavineño | 2.005 | 1.118 | 887 |
| Cayubaba | 1.424 | 738 | 686 |
| Chacobo | 826 | 418 | 408 |
| Chipaya | 786 | 400 | 386 |
| Chiquitano | 87.885 | 45.497 | 42.388 |
| Esse Ejja | 695 | 379 | 316 |
| Guaraní | 58.990 | 29.918 | 29.072 |
| Guarasugwe | 42 | 25 | 17 |
| Guarayo | 13.621 | 6.846 | 6.775 |
| Itonama | 10.275 | 5.356 | 4.919 |
| Joaquiniano | 2.797 | 1.510 | 1.287 |
| Kallawaya | 7.389 | 3.824 | 3.565 |
| Leco | 9.006 | 4.820 | 4.186 |
| Machinerí | 38 | 25 | 13 |
| Maropa | 2.857 | 1.550 | 1.307 |
| Mojeño | 31.078 | 16.564 | 14.514 |
| Moré | 155 | 78 | 77 |
| Mosetén | 1.989 | 1.095 | 894 |
| Movima | 12.213 | 6.349 | 5.864 |
| Murato | 143 | 78 | 65 |
| Pacahuara | 161 | 85 | 76 |
| Quechua | 1.281.116 | 626.307 | 654.809 |
| Sirionó | 446 | 245 | 201 |
| Tacana | 11.173 | 6.060 | 5.113 |
| Tapiete | 99 | 59 | 40 |
| Tsimane (Chimán) | 6.464 | 3.399 | 3.065 |
| Weenayek | 3.322 | 1.686 | 1.636 |
| Yaminahua | 132 | 54 | 78 |
| Yuki | 202 | 102 | 100 |
| Yuracaré | 3.394 | 1.709 | 1.685 |
| Yuracaré - Mojeño | 292 | 171 | 121 |
| other | 42.188 | 19.861 | 22.327 |
| Other not specified | 4.419 | 2.333 | 2.086 |
| Not belong | 4.032.014 | 1.975.811 | 2.056.203 |
Brazil

The Brazil ian census enumerated people by race in all censuses since 1872 with the exception of 1900, 1920, and 1970.[194] The Brazilian census classifies people by race as either white, black, pardo (brown), yellow (Asian), or indigenous.
Chile
Chile enumerated people by ethnicity in 1992.[6] The 2017 census included an option to identify as part of one of the country's indigenous groups.
Guyana
Guyana enumerated people by ethnicity from at least 1946 until at least 2002.[6][195]
Peru
Peru collected data in the 1940 census. In the 2017 census, questions about culture and ancestors were asked in more detail for the first time for the population of 12 years old and above.[196] Results were Mestizo 60.2%, Quechua 22.3%, White 5.9%, Afro-descendant 3.6%, Aymara 2.4%, Native or indigenous to the Amazon 0.3%, Asháninka 0.2%, Part of another Indigenous 0.2%, Aguaruna/Awajún 0.2%, Shipibo-Conibo/Konibo 0.1%, Japanese (Nikkei) 0.1%, Chinese (Tusan) 0.1%, Other 1.1%.[196]
See also
- Ancestry
- Census
- Demography
- Historical racial and ethnic demographics of the United States
- IBM and the Holocaust
- Majority minority
- Population and housing censuses by country
- Race and ethnicity in Brazil
- Race and ethnicity in the United States Census
- Visible minorities
- Languages in censuses
References
- ↑ 1.0 1.1 "RACE — The Power of an Illusion . Go Deeper". PBS. https://www.pbs.org/race/000_About/002_03-godeeper.htm.
- ↑ Fenton, Steve (2013-05-02). Ethnicity — Steve Fenton — Google Books. ISBN 9780745658438. https://books.google.com/books?id=ND1__tXqfDYC&q="ann+morning"+soviet+union&pg=PT11. Retrieved 2013-06-20.
- ↑ "Approaches To Racial And Ethnic Classification". http://unstats.un.org/unsd/demographic/sconcerns/popchar/Morning.pdf.
- ↑ 4.0 4.1 "Census and identity: The Politics of Race, Ethnicity and Language in National Censuses". Cambridge University. http://catdir.loc.gov/catdir/samples/cam031/2001037352.pdf.
- ↑ 5.0 5.1 5.2 "Angola". Institutionalized Ethnicity. 29 July 2011. http://institutionalizedethnicity.net/country-narratives/angola/.
- ↑ 6.00 6.01 6.02 6.03 6.04 6.05 6.06 6.07 6.08 6.09 6.10 6.11 6.12 6.13 6.14 6.15 6.16 6.17 6.18 6.19 6.20 6.21 6.22 6.23 6.24 6.25 6.26 6.27 6.28 6.29 6.30 6.31 6.32 6.33 6.34 6.35 6.36 6.37 6.38 6.39 6.40 6.41 6.42 6.43 6.44 6.45 6.46 6.47 6.48 6.49 6.50 6.51 6.52 6.53 6.54 6.55 6.56 6.57 6.58 6.59 6.60 6.61 6.62 6.63 6.64 6.65 "Ethnicity: A Review of Data Collection and Dissemination". United Nations Statistics Division. August 2003. http://unstats.un.org/unsd/demographic/sconcerns/popchar/Ethnicitypaper.pdf.
- ↑ 7.0 7.1 "Botswana". Institutionalized Ethnicity. 29 July 2011. http://institutionalizedethnicity.net/country-narratives/botswana/.
- ↑ Major Trading Currencies (5 June 2012). "Group not satisfied with 2010 Ghana census report". Ghana Business News. http://www.ghanabusinessnews.com/2012/06/05/group-not-satisfied-with-2010-ghana-census-report/.
- ↑ Maurice Odhiambo Makoloo. "Kenya: Minorities, Indigenous Peoples and Ethnic Diversity". Minority Rights Group International. http://www.minorityrights.org/download.php?id=147.
- ↑ "Kenya - Population Distribution". Kenya.rcbowen.com. http://kenya.rcbowen.com/people/population.html.
- ↑ "Kenya Holds First Census In A Decade, Causes Outcry Over Ethnic Identity". Associated Press. Huffingtonpost.com. 2009-08-25. http://www.huffingtonpost.com/2009/08/25/kenya-holds-first-census_n_268076.html.
- ↑ "Welcome to Kenya National Bureau of Statistics". Knbs.or.ke. http://www.knbs.or.ke/censusethnic.php.
- ↑ "Kenya 2009 Census Data | Population by Ethnic Affiliation". Mars Group Kenya. http://marsgroupkenya.org/census/?data=ethaf.
- ↑ Nyambura, Helen (2009-08-25). "Ethnic question in Kenya census stokes suspicions". Reuters. https://www.reuters.com/article/ozatp-kenya-census-idAFJOE57O0GP20090825.
- ↑ Balaton-Chrimes, Samantha; Cooley, Laurence (3 December 2021). "To count or not to count? Insights from Kenya for global debates about enumerating ethnicity in national censuses". Ethnicities (SAGE Publications) 22 (3): 146879682110563. doi:10.1177/14687968211056379. ISSN 1468-7968. http://pure-oai.bham.ac.uk/ws/files/150175243/Kenya_ethnic_enumeration_impasse_accepted_paper_071021_FINAL.pdf.
- ↑ Balaton-Chrimes, Samantha (2020). "Who are Kenya's 42(+) tribes? The census and the political utility of magical uncertainty". Journal of Eastern African Studies 15: 43–62. doi:10.1080/17531055.2020.1863642. ISSN 1753-1055.
- ↑ 17.0 17.1 "Lesotho". Institutionalized Ethnicity. 29 July 2011. http://institutionalizedethnicity.net/country-narratives/lesotho/.
- ↑ 18.0 18.1 18.2 "Malawi". Institutionalized Ethnicity. 29 July 2011. http://institutionalizedethnicity.net/country-narratives/malawi/.
- ↑ "Note sur les premiers résultats du Recensement Général de la Population et de l'Habitat 2014" (docx). Haut Commissariat au Plan. http://www.hcp.ma/Note-sur-les-premiers-resultats-du-Recensement-General-de-la-Population-et-de-l-Habitat-2014_a1516.html.(in French)
- ↑ 20.0 20.1 20.2 "Mozambique". Institutionalized Ethnicity. 29 July 2011. http://institutionalizedethnicity.net/country-narratives/mozambique/.
- ↑ "Namibia". Institutionalized Ethnicity. 8 August 2011. http://institutionalizedethnicity.net/country-narratives/namibia/.
- ↑ "Nigeria to include religion, ethnicity in 2016 census | Africa". World Bulletin. 2013-08-22. http://www.worldbulletin.net/?aType=haber&ArticleID=115785.
- ↑ Kiwuwa, David E. (2012). Ethnic Politics and Democratic Transition in Rwanda. Abingdon: Routledge. p. 71. ISBN 978-0415616089. https://books.google.com/books?id=uGclH0p46ogC&q=rwanda ethnicity census&pg=PA71.
- ↑ Agence France-Presse (2002-08-16). "Ethnic origins ignored in Rwanda's first census since genocide | ReliefWeb". Reliefweb.int. http://reliefweb.int/report/rwanda/ethnic-origins-ignored-rwandas-first-census-genocide.
- ↑ An Economic Survey of the Colonial Territories, Volumes 1-4. Great Britain, Colonial Office. 1952. p. 122. https://books.google.com/books?id=Gr8vAAAAYAAJ. Retrieved 22 November 2014.
- ↑ Ethnographic Survey of Africa, Volume 5, Issue 1. International African Institute. 1969. pp. 45 & 50. https://books.google.com/books?id=szhNAQAAIAAJ. Retrieved 22 November 2014.
- ↑ Menkhaus, Ken (2003). "Bantu ethnic identities in Somalia". Annales d'Éthiopie XIX: 323. doi:10.3406/ethio.2003.1051. http://www.persee.fr/articleAsPDF/ethio_0066-2127_2003_num_19_1_1051/article_ethio_0066-2127_2003_num_19_1_1051.pdf. Retrieved 22 November 2014.
- ↑ Ministry of National Planning (1985). The 1982 labour force survey: analytical report. Ministry of National Planning of Somalia, Central Statistical Department. p. 126. https://books.google.com/books?id=C5IoAQAAIAAJ. Retrieved 22 November 2014.
- ↑ Ministry of Information and National Guidance (1974). Somalia and the Arab League. Ministry of Information and National Guidance. p. 7. https://books.google.com/books?id=4FkMAQAAIAAJ. Retrieved 22 November 2014.
- ↑ "Provisional Constitution". Federal Government of Somalia. http://unpos.unmissions.org/LinkClick.aspx?fileticket=RkJTOSpoMME=.
- ↑ "SOMALIA: Gov't to launch population census ahead of 2016 elections". Koonfurta. 10 October 2014. http://koonfurta.com/somalia-govt-to-launch-population-census-ahead-of-2016-elections/.
- ↑ 32.0 32.1 "South Africa". Institutionalized Ethnicity. 1986-07-23. http://institutionalizedethnicity.net/country-narratives/south-africa/.
- ↑ Census 2011 Household Questionnaire A[yes|permanent dead link|dead link}}]
- ↑ 34.0 34.1 "Swaziland". Institutionalized Ethnicity. 29 July 2011. http://institutionalizedethnicity.net/country-narratives/swaziland/.
- ↑ "Tanzania". Institutionalized Ethnicity. 29 July 2011. http://institutionalizedethnicity.net/country-narratives/tanzania.
- ↑ "The 2012 Uganda Population and Housing Census". The 2012 Uganda Population & Housing Census Bulletin 1. March 2011. http://www.ubos.org/UgCensus2012/docs/2012_CENSUS_BULLETIN_Vol1.pdf.
- ↑ "Uganda - SOCIETY". Mongabay.com. http://www.mongabay.com/reference/country_studies/uganda/SOCIETY.html.
- ↑ 38.0 38.1 38.2 "Zambia". Institutionalized Ethnicity. 8 August 2011. http://institutionalizedethnicity.net/country-narratives/zambia/.
- ↑ 39.0 39.1 "Zimbabwe". Institutionalized Ethnicity. 8 August 2011. http://institutionalizedethnicity.net/country-narratives/zimbabwe/.
- ↑ 40.00 40.01 40.02 40.03 40.04 40.05 40.06 40.07 40.08 40.09 40.10 40.11 40.12 40.13 40.14 40.15 40.16 40.17 40.18 "Demoscope Weekly - Annex. Statistical indicators reference". Demoscope.ru. 2012-09-16. http://demoscope.ru/weekly/ssp/rus_lan_97_uezd_eng.php.
- ↑ 41.00 41.01 41.02 41.03 41.04 41.05 41.06 41.07 41.08 41.09 41.10 41.11 41.12 41.13 41.14 41.15 41.16 41.17 "Демоскоп Weekly - Приложение. Справочник статистических показателей". Demoscope.ru. http://demoscope.ru/weekly/ssp/rus_rel_97.php?reg=0.
- ↑ 42.00 42.01 42.02 42.03 42.04 42.05 42.06 42.07 42.08 42.09 42.10 42.11 42.12 42.13 42.14 42.15 42.16 42.17 "Приложение Демоскопа Weekly". Demoscope.ru. 2013-01-15. http://demoscope.ru/weekly/ssp/census_types.php?ct=6.
- ↑ "Ethnic composition of Abkhazia 2003". Pop-stat.mashke.org. http://pop-stat.mashke.org/abkhazia-ethnic2003.htm.
- ↑ "Ethnic composition of Abkhazia 2011". Pop-stat.mashke.org. http://pop-stat.mashke.org/abkhazia-ethnic2011.htm.
- ↑ "Afghanistan Statistical Yearbook 2009-10". http://cso.gov.af/Content/files/Population.pdf.
- ↑ "Ethnic composition of Armenia 2001". Pop-stat.mashke.org. http://pop-stat.mashke.org/armenia-ethnic2001.htm.
- ↑ "CENSUS PROGRAMME (CONTENT OF QUESTIONNAIRE) 2011 CENSUS OF THE REPUBLIC OF ARMENIA". http://www.armstat.am/file/doc/99465273.pdf.
- ↑ "Ethnic composition of Azerbaijan 1999". Pop-stat.mashke.org. http://pop-stat.mashke.org/azerbaijan-ethnic1999.htm.
- ↑ "Ethnic composition of Azerbaijan 2009". Pop-stat.mashke.org. 1971-04-07. http://pop-stat.mashke.org/azerbaijan-ethnic2009.htm.
- ↑ 50.0 50.1 "Bahraini Census 2010 - تعداد السكــان العام للبحريــن 2010". Census2010.gov.bh. http://www.census2010.gov.bh/results_en.php.
- ↑ 51.0 51.1 51.2 "Census of India - Census Terms". Censusindia.gov.in. http://censusindia.gov.in/Data_Products/Library/Indian_perceptive_link/Census_Terms_link/censusterms.html.
- ↑ "United Nations Statistics Division - Demographic and Social Statistics". Unstats.un.org. http://unstats.un.org/unsd/demographic/products/dyb/dyb2.htm#2001.
- ↑ 53.0 53.1 53.2 "Burma's troublesome census | Democratic Voice of Burma". Dvb.no. 2009-08-17. http://www.dvb.no/analysis/burma’s-troublesome-census/21931.
- ↑ 54.0 54.1 Sonu Trivedi (2012-11-27). "Opinion / Op-Ed : Myanmar's census a crucial democracy test". The Hindu (Chennai, India). http://www.thehindu.com/opinion/op-ed/myanmars-census-a-crucial-democracy-test/article4137474.ece.
- ↑ Mark Mackinnon (2012-08-23). "China's disappearing languages deemed 'not that important'". The Globe and Mail (Toronto). https://www.theglobeandmail.com/news/world/asia-pacific/chinas-disappearing-languages-deemed-not-that-important/article1792549/.
- ↑ "Ethnic composition of Georgia 2002". Pop-stat.mashke.org. http://pop-stat.mashke.org/georgia-ethnic2002.htm.
- ↑ Suryadinata, Leo (2008). Ethnic Chinese in Contemporary Indonesia - Leo Heng Chew Suryadinata - Google Books. ISBN 9789812308351. https://books.google.com/books?id=UFNKQcvGNSAC&q=census+ethnic&pg=PA20. Retrieved 2013-03-21.
- ↑ "Statistical Abstract of Israel 2011". cbs.gov.il. 2011-09-26. http://www1.cbs.gov.il/reader/shnatonenew_site.htm.
- ↑ "Statistical Abstract of Israel 2012 National Population Estimates". CBS. http://www.cbs.gov.il/shnaton63/st_eng02.pdf.
- ↑ "Statistical Abstract of Israel 2012 - No. 63 Subject 2 - Table No. 25". .cbs.gov.il. http://www1.cbs.gov.il/reader/shnaton/templ_shnaton_e.html?num_tab=st02_25&CYear=2012.
- ↑ "Ethnodemographic situation in Kazakhstan". http://www.ide.go.jp/English/Publish/Download/Mes/pdf/51_02.pdf.
- ↑ "Ethnic composition of Kazakhstan 2009". Pop-stat.mashke.org. http://pop-stat.mashke.org/kazakhstan-ethnic2009reg-census.htm.
- ↑ "5.01.00.03 Национальный состав населения". http://www.stat.kg/stat.files/din.files/census/5010003.pdf.
- ↑ "Ethnic composition of Kyrgyzstan 2009". Pop-stat.mashke.org. http://pop-stat.mashke.org/kyrgyzstan-ethnic2009v1.htm.
- ↑ "Ethnic composition of Kyrgyzstan 2009". Pop-stat.mashke.org. http://pop-stat.mashke.org/kyrgyzstan-ethnic2009v2.htm.
- ↑ Charles Hirschman (August 1987). "The Meaning and Measurement of Ethnicity in Malaysia: An Analysis of Census Classifications". The Journal of Asian Studies (Association for Asian Studies) 46 (3): 555–582. doi:10.2307/2056899. http://faculty.washington.edu/charles/pubs/1987-MeaningandMeasurementofEthnicityinMalaysia.pdf.
- ↑ "Ethnic composition of Nagorno-Karabakh Republic (self-proclaimed) 2005". Pop-stat.mashke.org. http://pop-stat.mashke.org/nkr-ethnic2005.htm.
- ↑ [1] [|permanent dead link|dead link}}]
- ↑ 69.0 69.1 "Национальный вопрос и национальная култура в Северо-Кавказском крае (Итоги и перспективы): К предстоящему съезду горских народов" (Natsionalny vopros i natsionalnaya kultura v Severo-Kavkazskom kraye (Itogi i perspektivy): K predstoyashchemu syezdu gorskikh narodov), Rostov-on-Don, 1926.
- ↑ Slezkine, Yuri (1994). "The USSR as a Communal Apartment, or How a Socialist State Promoted Ethnic Particularism". Slavic Review 53 (2): 414–452. doi:10.2307/2501300.
- ↑ 71.0 71.1 Martin, Terry (1998). "The Origins of Soviet Ethnic Cleansing". The Journal of Modern History 70 (4): 813–861. doi:10.1086/235168. https://dash.harvard.edu/bitstream/handle/1/3229636/Martin 1998.pdf?sequence=2.
- ↑ "Приложение Демоскопа Weekly". Demoscope.ru. 2011-12-26. http://demoscope.ru/weekly/ssp/census_types.php?ct=6.
- ↑ F. Joseph Dresen (2002-11-18). "Russia Counts: The 2002 Russian Census". Wilson Center. http://www.wilsoncenter.org/publication/russia-counts-the-2002-russian-census.
- ↑ 74.0 74.1 74.2 "Демоскоп Weekly - Приложение. Справочник статистических показателей". Demoscope.ru. 2007-05-27. http://www.demoscope.ru/weekly/ssp/rus_nation.php.
- ↑ Census of Population 2010 Advance Census Release. Department of Statistics, Ministry of Trade & Industry, Republic of Singapore. 2010. ISBN 978-981-08-6819-2. http://www.singstat.gov.sg/pubn/popn/c2010acr.pdf. Retrieved July 2, 2011.
- ↑ "Table_of_Contents_Central_Asia Series". http://www.nps.edu/programs/ccs/Docs/Central_Asia/Tajikistan_July09.pdf.
- ↑ 77.0 77.1 (Karpat 1978)
- ↑ 78.0 78.1 (Shaw 1978)
- ↑ "TURKMENISTAN". state.gov. https://2009-2017.state.gov/documents/organization/171762.pdf.
- ↑ "Central Asia Executive Summary Series: Uzbekistan Country Profile". Naval Postgraduate School. June 2009. http://www.nps.edu/programs/ccs/Docs/Central_Asia/Uzbekistan_Overview_June09.pdf.
- ↑ 81.0 81.1 "Microsoft Word - Ethnicitypaper.doc". http://unstats.un.org/unsd/demographic/sconcerns/popchar/Ethnicitypaper.pdf.
- ↑ "Tong Cuc Thong Ke". Gso.gov.vn. http://www.gso.gov.vn/default.aspx?tabid=503&ItemID=1841.
- ↑ [unstats.un.org/unsd/demographic/.../Session8.0_VietNam.ppt]
- ↑ "Ethnic composition of Albania 1989". Pop-stat.mashke.org. http://pop-stat.mashke.org/albania-ethnic1989.htm.
- ↑ 85.0 85.1 Gezim Krasniqi. "Natitonality and census in Albania". Citsee.Eu. http://www.citsee.eu/blog/politics-numbers-and-identity-albania.
- ↑ 86.0 86.1 "Albania Post Enumeration Survey". 2011. http://census.al/Resources/Data/Census2011/PES Questionnaire ENG.pdf.
- ↑ "Ethnic composition of Belarus 1999". Pop-stat.mashke.org. http://pop-stat.mashke.org/belarus-ethnic1999.htm.
- ↑ "Ethnic composition of Belarus 2009". Pop-stat.mashke.org. http://pop-stat.mashke.org/belarus-ethnic2009.htm.
- ↑ Klemenčić, Mladen (1994). Territorial Proposals for the Settlement of the War in Bosnia-Hercegovina ... - Mladen Klemenčić - Google Books. ISBN 9781897643150. https://books.google.com/books?id=V9DtlRfO6JMC&q=yugoslavia+census+1948+1961+serbs&pg=PA16. Retrieved 2013-03-21.
- ↑ "Ethnic composition of Bosnia & Herzegovina 1991". Pop-stat.mashke.org. http://pop-stat.mashke.org/bosnia-ethnic1991.htm.
- ↑ R.J. Crampton (2007). Bulgaria. OUP Oxford. ISBN 9780191513312. https://books.google.com/books?id=DdEPbQzOjFQC&q=bulgaria+census+ethnicity+1880+1887+mother+tongue&pg=PA425. Retrieved 2012-12-02.
- ↑ "2011 POPULATION CENSUS – Main Results". http://www.nsi.bg/census2011/PDOCS2/Census2011final_en.pdf.
- ↑ "Ethnic composition of Croatia 2001". Pop-stat.mashke.org. http://pop-stat.mashke.org/croatia-ethnic2001.htm.
- ↑ "Og". http://www.dzs.hr/Eng/censuses/census2011/forms/langs/Englezi OP.pdf.
- ↑ "Second Czechoslovak census held 80 years ago". Prague Monitor. 2010-11-30. http://praguemonitor.com/2010/11/30/second-czechoslovak-census-held-80-years-ago.
- ↑ "Minority Rights in Estonia". Legal Information Centre for Human Rights. http://www2.ohchr.org/english/bodies/hrc/docs/ngos/LIC_Estonia99.pdf.
- ↑ "Ethnic composition of Estonia 2000". Pop-stat.mashke.org. http://pop-stat.mashke.org/estonia-ethnic2000.htm.
- ↑ "Population by ethnic nationality, 1 January, years - Statistics Estonia". Stat.ee. 2012-03-30. http://www.stat.ee/34278.
- ↑ "Population by Nationality". Estonia.eu. http://estonia.eu/about-estonia/country/population-by-nationality.html.
- ↑ Juhan Tere, BC, Tallinn (2012-09-17). "Census 2011: people of 192 ethnic nationalities live in Estonia :: The Baltic Course | Baltic States news & analytics". The Baltic Course. http://www.baltic-course.com/eng/analytics/?doc=62935.
- ↑ "Table: Language according to age and sex by region 1990 - 2011". Pxweb2.stat.fi. http://pxweb2.stat.fi/Dialog/varval.asp?ma=030_vaerak_tau_102_en&ti=Language+according+to+age+and+gender+by+region+1990+-+2010&path=../Database/StatFin/vrm/vaerak/&lang=1&multilang=en.
- ↑ 102.0 102.1 "Powered by Google Docs". https://docs.google.com/viewer?a=v&q=cache:vLz6pnq_4oAJ:www.brookings.edu/fp/cusf/analysis/laurence.pdf+france+census+race+ethnicity+1872+law&hl=en&gl=us&pid=bl&srcid=ADGEESiJ1dyvouY6Ibx8dja6tnv8e0sqVHvda_pLjbRRf94-Opttxtn4eBTEDpPHnM5A8uyb_RcxB4IVVPWJTc2M_cKtnshQHFZFpIqG53wsjVbhXtoCwZiQaEGMKL3olzpyzvf33sLa&sig=AHIEtbTLE-kOeESgjIHxqg6u_5kmCZk6yQ.
- ↑ Bleich, Erik (2001-05-01). "Race Policy in France | Brookings Institution". Brookings.edu. http://www.brookings.edu/research/articles/2001/05/france-bleich.
- ↑ "Next Census in France May Track Race, Ethnicity and Religion - The Leadership Conference on Civil and Human Rights". Civilrights.org. http://www.civilrights.org/archives/2009/04/255-french-census.html.
- ↑ Admin, The (2012-04-16). "Despite ethnic tensions, counting voters by race remains taboo in French presidential campaign". Black Politics on the Web. http://blackpoliticsontheweb.com/2012/04/16/despite-ethnic-tensions-counting-voters-by-race-remains-taboo-in-french-presidential-campaign/.
- ↑ "Bearers of a Common Fate ? The half Jews in Nazi Germany". Wernercohn.com. http://www.wernercohn.com/Paulus.html#5.
- ↑ A népesség változó etnikai arculata Magyarország mai területén (map+data+essay) (Kocsis Károly, Bottlik Zsolt, Hungarian Academy of Sciences - Földrajztudományi Kutatóintézet, Budapest, 2009, ISBN:978-963-9545-19-9)
- ↑ Kocsis, Karoly; Kocsis-Hodosi, Eszter (1938-11-02). Ethnic Geography of the Hungarian Minority on the Carpathian Basin - Kocsis, Károly, Eszter Kocsisné Hodosi - Google Books. ISBN 9781931313759. https://books.google.com/books?id=-zZ_NVM9mNEC&q=hungary+census+1941&pg=PA116. Retrieved 2013-03-21.
- ↑ ireland.com / In Time's Eye / Who we are
- ↑ "Population Usually Resident and Present in the State by Age Group, Sex, Ethnic or Cultural Background and CensusYear - StatBank - data and statistics". Cso.ie. http://www.cso.ie/px/pxeirestat/Statire/SelectVarVal/Define.asp?maintable=CD701&PLanguage=0.
- ↑ "Report on the size and ethnic composition of the population of Kosovo". 14 August 2002. http://www.icty.org/x/file/About/OTP/War_Demographics/en/milosevic_kosovo_020814.pdf.
- ↑ "Ethnic composition of Kosovo 2011". Pop-stat.mashke.org. http://pop-stat.mashke.org/kosovo-ethnic2011.htm.
- ↑ "Ethnicities in Latvia. Statistics". Roots-saknes.lv. http://www.roots-saknes.lv/Ethnicities/ethnicities_statistics.htm.
- ↑ "Ethnic composition of Latvia 2000". Pop-stat.mashke.org. http://pop-stat.mashke.org/latvia-ethnic2000.htm.
- ↑ "Table: TSG11-06. RESIDENT POPULATION ON MARCH 1, 2011 BY ETHNICITY, SEX AND AGE GROUP". Data.csb.gov.lv. 2011-03-01. http://data.csb.gov.lv/Dialog/varval.asp?ma=TSG11-06a&ti=TSG11-06.+RESIDENT+POPULATION+ON+MARCH+1,+2011+BY+ETHNICITY,+SEX+AND+AGE+GROUP&path=../DATABASEEN/tautassk_11/Final results of the Population and Housing Census 2011/&lang=1.[yes|permanent dead link|dead link}}]
- ↑ Kasatkina, Natalija; Marcinkevicius, Andrius. "Russians in Lithuania According to the 1897 and 1923 Censuses: Comparative Analysis". Ethnicity Studies. ISSN 1822-1041. http://www.ces.lt/wp-content/uploads/2012/03/EtSt_Kasatkina_Marcinkevicius_2008.pdf.
- ↑ "Ethnic composition of Lithuania 2001". Pop-stat.mashke.org. http://pop-stat.mashke.org/lithuania-ethnic2001.htm.
- ↑ "Lithuania's population stands below three million". 15min.lt. 2013-02-04. http://www.15min.lt/en/article/in-lithuania/lithuania-s-population-stands-at-3-043-million-525-259643.
- ↑ "Ethnic composition of Moldova 2004". Pop-stat.mashke.org. http://pop-stat.mashke.org/moldova-ethnic2004.htm.
- ↑ Results of Population and Housing Census in the Republic of Moldova in 2014
- ↑ "Montenegrin Census' from 1909 to 2003 - Aleksandar Rakovic". Njegos.org. 2004-09-23. http://www.njegos.org/census/index.htm.
- ↑ "Ethnic composition of Montenegro 2003". Pop-stat.mashke.org. http://pop-stat.mashke.org/montenegro-ethnic2003.htm.
- ↑ "Montenegro - a census like no other?". TransConflict. http://www.transconflict.com/2011/07/montenegro-a-census-like-no-other-147/.
- ↑ "Changes in ethnic structure in Macedonia after emigration of Turkish minority". http://epc2008.princeton.edu/papers/80013.
- ↑ Macedonian census, language and religion
- ↑ Axelsson, Per; Sköld, Peter (2011-08-15). Indigenous Peoples and Demography: The Complex Relation Between Identity and ... - Google Books. ISBN 9780857450036. https://books.google.com/books?id=mbMs68rD9doC&q=norway+census+ethnicity&pg=PA173. Retrieved 2013-09-01.
- ↑ "Norwegian National Archives". 2013. http://www.ssb.no/befolkning/artikler-og-publikasjoner/paa-vei-mot-eu-medlemskap.
- ↑ "Polish 1921 Census and Demographic Data". Kresy.co.uk. http://www.kresy.co.uk/census_demographic.html.
- ↑ 129.0 129.1 129.2 "Language minorities in Poland at the moment of accession to the EU, by Marta Moskal". http://www6.gencat.net/llengcat/noves/hm04primavera-estiu/docs/moskal.pdf.
- ↑ Viegas, Nuno. "Branco, negro, cigano ou asiático? Censos 2021 devem perguntar a etnia, recomenda grupo de trabalho" (in pt-PT). https://observador.pt/2019/04/04/branco-negro-cigano-ou-asiatico-censos-2021-devem-perguntar-a-etnia-recomenda-grupo-de-trabalho/.
- ↑ "Censos 2021: religião sim, etnia não" (in pt). https://ionline.sapo.pt/artigo/734048/censos-2021-religiao-sim-etnia-nao?seccao=Portugal_i.
- ↑ "INE avança este ano com pergunta sobre etnia" (in pt-PT). https://expresso.pt/sociedade/2021-04-01-INE-avanca-este-ano-com-pergunta-sobre-etnia-8784b541.
- ↑ "Censuses of 1859-1990 | Recensamant 2011". Recensamantromania.ro. http://www.recensamantromania.ro/en/history/censuses-1859-1990/.
- ↑ The Statesman's Year-Book. St. Martin's Press. 1889. p. 407.
- ↑ New International Yearbook. Dodd, Mead and Company. 1915. p. 612.
- ↑ "The Hungarian Minority's Situation in Ceausescu's Romania". Hungarianhistory.com. http://www.hungarianhistory.com/lib/humis/humis07.htm.
- ↑ "Population Statistics of Eastern Europe § Romania". Pop-stat.mashke.org. http://pop-stat.mashke.org/#romania.
- ↑ "Comunicat DATE PROVIZORII RPL 2011_transmis". http://www.insse.ro/cms/files\statistici\comunicate\alte\2012\Comunicat DATE PROVIZORII RPL 2011e.pdf.
- ↑ "COMUNICAT DE PRESĂ 2 februarie 2012 privind rezultatele provizorii ale Recensământului Populaţiei şi Locuinţelor – 2011". February 2, 2012. http://www.recensamantromania.ro/wp-content/uploads/2012/02/Comunicat_DATE_PROVIZORII_RPL_2011.pdf.
- ↑ "Romania". Virtual Jewish Library. http://www.jewishvirtuallibrary.org/jsource/vjw/romaniatoc.html.
- ↑ "Ethnic Minorities in Serbia - An overview". Organization for Security and Co-operation in Europe. February 27, 2008. http://www.osce.org/serbia/30908.
- ↑ "Serbia has fewer citizens, census results show". B92. 2011-11-16. http://www.b92.net/eng/news/society.php?yyyy=2011&mm=11&dd=16&nav_id=77354.
- ↑ "László Gyurgyik:Hungarians in Czechoslovakia: Changes in Their Population And Settlement System from 1918 to the Present Day". Hhrf.org. http://www.hhrf.org/kisebbsegkutatas/mr_04/cikk.php?id=1188.
- ↑ "Demografickй ъdaje zo sинtania Њudu 1921". Sodb.infostat.sk. http://sodb.infostat.sk/sodb/eng/1848-2001/tab.III.2-2B_en.htm.
- ↑ "Table 11. Resident population by nationality - 2001, 1991". Statistical Office of the SR. 2005. http://portal.statistics.sk/files/Sekcie/sek_600/Demografia/SODB/Tabulky/Tabulky_AJ_SODB/tab11.pdf.
- ↑ "Statistični urad RS - Popis 2002". Stat.si. http://www.stat.si/popis2002/en/rezultati/rezultati_red.asp?ter=SLO&st=7.
- ↑ "Ol37-09-05". Olvia.idknet.com. http://www.olvia.idknet.com/ol37-09-05.htm.
- ↑ "The Plan for the Extermination of Romanian Jewry". Jewish Virtual Library. http://www.jewishvirtuallibrary.org/jsource/Holocaust/romanianjewry.html.
- ↑ "Ethnic composition of Ukraine 2001". Pop-stat.mashke.org. http://pop-stat.mashke.org/ukraine-ethnic2001.htm.
- ↑ K. Sillitoe; P. H. White (1992). "Ethnic Group and the British Census: the Search for a Question". Journal of the Royal Statistical Society, Series A 155 (1): 141–163. doi:10.2307/2982673. PMID 12159122.
- ↑ Christian Dustmann; Tommaso Frattini; Nikolaos Theodoropoulos (2011). "Ethnicity and Second Generation Immigrants". The Labour Market in Winter: The State of Working Britain. doi:10.1093/acprof:osobl/9780199587377.003.0016. ISBN 9780199587377. http://www.ucl.ac.uk/~uctpb21/Cpapers/Ethn_2gen_revision_C1.pdf.
- ↑ "Who are the UK's minority ethnic groups? Issues of identification and measurement in a longitudinal study". September 2008. https://www.iser.essex.ac.uk/files/iser_working_papers/2008-26.pdf.
- ↑ "New Ethnicity Code List". The Information Authority. http://www.theia.org.uk/NR/rdonlyres/9568290B-80AA-4030-AED3-046A8E5C3F92/0/L12V_1_2_NewEthnicityCodes.doc.
- ↑ Keith Archibald Forbes. "Bermuda's Population and local Expatriate Organizations". Bermuda-online.org. http://www.bermuda-online.org/population.htm.
- ↑ "2011 Census - About the census: History of the Census of Canada". 2.statcan.gc.ca. 2013-01-10. http://www12.statcan.gc.ca/census-recensement/2011/ref/about-apropos/history-histoire-eng.cfm.
- ↑ 156.0 156.1 "ARCHIVED - PDF Document". 3.statcan.gc.ca. 2010-05-17. http://www23.statcan.gc.ca/imdb-bmdi/pub/instrument/3901_Q2_V3-eng.pdf.
- ↑ 157.0 157.1 "2006 Census : Ethnic Origin Reference Guide". 2.statcan.gc.ca. 2011-05-04. https://www12.statcan.gc.ca/census-recensement/2006/ref/rp-guides/ethnic-ethnique-eng.cfm.
- ↑ Beech, Bettina M.; Goodman, Maurine (2004). Race and Research - Google Books. ISBN 9780875530307. https://books.google.com/books?id=tRzXJAFODuwC&q=canada+census+1891+ethnic+origin&pg=PA4. Retrieved 2013-03-21.
- ↑ "ARCHIVED — Canada Gazette – ORDERS IN COUNCIL". Gazette.gc.ca. 2012-11-09. http://www.gazette.gc.ca/rp-pr/p1/2010/2010-08-21/html/order-decret-eng.html.
- ↑ "2011 National Household Survey Questions". 2.statcan.gc.ca. http://www12.statcan.gc.ca/NHS-ENM/ref/Questionnaires/2011NHS-ENM-eng.cfm#Q17.
- ↑ "Historical statistics of Canada: Section A: Population and Migration". Statcan.gc.ca. 2008-10-22. http://www.statcan.gc.ca/pub/11-516-x/sectiona/4147436-eng.htm.
- ↑ "Microsoft Word - 97-557-XIE_immigration_26-11-07.doc". http://www12.statcan.ca/census-recensement/2006/as-sa/97-557/pdf/97-557-XIE2006001.pdf.
- ↑ "Report on the Census of Cuba, 1899 :: Census of Cuba 1899". http://digital.tcl.sc.edu/cdm4/document.php?CISOROOT=/CCC&CISOPTR=1683&REC=5&CISOBOX=foreign.
- ↑ "Censo de poblacion y viviendas Cuba". January 2014. http://www.onei.gob.cu/sites/default/files/informe_nacional_censo_0.pdf.
- ↑ "2000 Round of Population and Housing Census Data Analysis Sub-Project". http://www.caricomstats.org/Files/Publications/NCR Reports/Jamaica.pdf.
- ↑ "Census 2011 General Report". https://statinja.gov.jm/PublicationReleases.aspx.
- ↑ 167.0 167.1 "Population Composition by Race and Ethnicity: North America". http://sociology.as.nyu.edu/docs/IO/1043/Pop.Comp.IESBS.2001.pdf.
- ↑ Don Winner. "National Census in Panama This Sunday, 16 May 2010". Panama Guide. http://www.panama-guide.com/article.php/20100511134852268.
- ↑ Prewitt, Kenneth (2013-08-21). "Fix the Census' Archaic Racial Categories". The New York Times. https://www.nytimes.com/2013/08/22/opinion/fix-the-census-archaic-racial-categories.html?pagewanted=all&_r=0.
- ↑ "2-11-Z-COLONIAL & PRE-FEDERAL.pdf". http://www2.census.gov/prod2/statcomp/documents/CT1970p2-13.pdf.
- ↑ "Historical Census Statistics on Population Totals By Race, 1790 to 1990, and By Hispanic Origin, 1970 to 1990, For The United States, Regions, Divisions, and States". Census.gov. https://www.census.gov/population/www/documentation/twps0056/twps0056.html.
- ↑ "Multiracial Identity and the U.S. Census, ProQuest Discovery Guides". Csa.com. http://www.csa.com/discoveryguides/census/review3.php.
- ↑ 173.00 173.01 173.02 173.03 173.04 173.05 173.06 173.07 173.08 173.09 173.10 173.11 173.12 173.13 173.14 173.15 "Historical Census Statistics on Population Totals By Race, 1790 to 1990, and By Hispanic Origin, 1970 to 1990, For The United States, Regions, Divisions, and States". Census.gov. https://www.census.gov/population/www/documentation/twps0056/twps0056.html.
- ↑ Mae M. Ngai. "The Architecture of Race in American Immigration Law: A Reexamination of the Immigration Act of 1924". The Journal of American History (The History Cooperative) 86 (1). http://chnm.gmu.edu/staff/sharon/readings/ngai.html. Retrieved 2013-06-22.
- ↑ Patrick D. Lukens, A Quiet Victory for Latino Rights: FDR and the Controversy over Whiteness (University of Arizona Press, 2012)
- ↑ "Table D-4. Hispanic Origin (of Any Race), for the United States, Regions, Divisions, and States: 1940 and 1970 (Sample Data) (See text for sources, definitions, and explanations)". https://www.census.gov/population/www/documentation/twps0056/tabD-04.pdf.
- ↑ "Table D-2. Hispanic Origin (of Any Race), for the United States, Regions, Divisions, and States: 1990 (Sample Data) (See text for sources, definitions, and explanations)". https://www.census.gov/population/www/documentation/twps0056/tabD-02.pdf.
- ↑ "IPUMS USA: 1980 Census Questions and Instructions". Usa.ipums.org. http://usa.ipums.org/usa/voliii/items1980.shtml.
- ↑ Leeman, Jennifer (2004). "Racializing language: A history of linguistic ideologies in the US Census" (in en). Journal of Language and Politics 3 (3): 507–534. doi:10.1075/jlp.3.3.08lee. ISSN 1569-2159. https://www.academia.edu/335479.
- ↑ "Tech Paper 29: Table 6. Mother Tongue of the Foreign-Born Population: 1910 to 1940, 1960, and 1970". Census.gov. https://www.census.gov/population/www/documentation/twps0029/tab06.html.
- ↑ "Table 2 (download)". Census.gov. https://www.census.gov/hhes/socdemo/language/data/acs/Table2.xls.
- ↑ 182.0 182.1 182.2 "Census Bureau Proposes Changes: Hispanics As Distinct Category And End Use Of Term 'Negro'". Huffingtonpost.com. 2012-08-09. http://www.huffingtonpost.com/2012/08/09/census-bureau-changes-race-hispanics-negro_n_1760467.html.
- ↑ Turnbull, Lornet. "Latinos may get own race category on census form | Local News". The Seattle Times. http://seattletimes.com/html/localnews/2019032486_censuschange31m.html.
- ↑ "Not Quite White: Race Classification and the Arab American Experience | The Arab American Institute". Aaiusa.org. http://www.aaiusa.org/pages/not-quite-white-race-classification-and-the-arab-american-experience.
- ↑ 185.0 185.1 Luke Keele; Ismail White (December 13, 2011). "African American Turnout in Majority-Minority Districts". http://www.personal.psu.edu/ljk20/MAJ-MINOR.pdf.
- ↑ 186.0 186.1 186.2 "Historical Census Statistics on the Foreign-Born Population of the United States: 1850-2000". Census.gov. https://www.census.gov/population/www/documentation/twps0081/twps0081.html.
- ↑ "2071.0 - Reflecting a Nation: Stories from the 2011 Census, July 2011". Abs.gov.au. 2012-06-20. http://abs.gov.au/ausstats/abs@.nsf/Lookup/2071.0Feature+Article2July+2011.
- ↑ "1.1 CENSUS OF POPULATION NY ETHNICITY 1881 - 2007". Fiji Bureau of Statistics. June 2012. http://www.spc.int/prism/country/fj/stats/Key Stats/Population/1.1 census of population.pdf.
- ↑ 189.0 189.1 "Introduction to the Census - Statistics New Zealand". Stats.govt.nz. 2006-11-24. http://www.stats.govt.nz/Census/about-2006-census/introduction-to-the-census/history-of-the-census-in-nz.aspx.
- ↑ "Tendencias recientes de la Inmigración internacional". Indec. February 2004. http://www.indec.gov.ar/webcenso/aquisecuenta/Aqui12.pdf.
- ↑ CEPAL - Naciones Unidas. "CEPAL - Los pueblos indígenas de Bolivia: diagnóstico sociodemográfico a partir del censo del 2001". Eclac.org. http://www.eclac.org/cgi-bin/getProd.asp?xml=/publicaciones/xml/3/23263/P23263.xml&xsl=/celade/tpl/p9f.xsl&base=/celade/tpl/top-bottom.xsl.
- ↑ 192.0 192.1 192.2 "Bolivia's Census Omits 'Mestizo' as Category - ABC News". Abcnews.go.com. https://abcnews.go.com/International/wireStory/bolivias-census-omits-mestizo-category-17779349#.ULm6AJtQAak.
- ↑ "Census in Bolivia". http://www.ine.gob.bo:8081/censo2012/PDF/resultadosCPV2012.pdf.
- ↑ "Mapping the ethno-racial composition of the Brazilian population has long been viewed as problematic due principally to the am". http://www.sscnet.ucla.edu/soc/faculty/telles/Paper_AffirmationandAmbiguity.pdf.
- ↑ "Bureau of Statistics - Guyana". Statisticsguyana.gov.gy. http://www.statisticsguyana.gov.gy/census.html.
- ↑ 196.0 196.1 Perú: Perfil Sociodemográfico (Report). Instituto Nacional de Estadística e Informática. p. 214. https://www.inei.gob.pe/media/MenuRecursivo/publicaciones_digitales/Est/Lib1539/libro.pdf. Retrieved 5 March 2020.
Works cited
- Karpat, Kemal H. (May 1978). "Ottoman Population Records and the Census of 1881/82–1893". International Journal of Middle East Studies 9 (2): 237–274. doi:10.1017/S0020743800000088.
- Shaw, Standford J. (August 1978). "The Ottoman Census System and Population, 1831–1914". International Journal of Middle East Studies 9 (3): 325–338. doi:10.1017/S0020743800033602.
External links
- Census racial/ethnic/national origin questions from various countries [Link Broken]
Historical data
- Ethnicity and Race Data for every country in the world which had this census category between 1985 and 2003
- Language Data for every country in the world which had this census category between 1985 and 2003
- Bulgaria Ethnicity Data for 1900-2011 for the whole country and for urban and rural areas
- Canada Ethnic Origin Data for 1871-1971 (on page 17)
- Eastern Europe, Kazakhstan, and Kyrgyzstan Ethnicity/Nationality Data for the late 20th century and early 21st century
- Fiji Ethnicity Data for 1881-2007
- Ireland Ethnicity Data for 2011
- Israel Ethnicity Data for 1948-2011 for Israeli Districts and Sub-Districts
- Russia, Russian Empire, and USSR Ethnicity/Nationality Data for 1897-2010 by Guberniyas/Oblasts/SSRs
- United Kingdom Ethnicity Data for 1991-2011
- United States Race and Ethnicity Data for 1790-1990 for U.S. Regions and States
- United States Race and Ethnicity Data for 1790-1990 for Large Cities and Other Urban Places
- United States Race and Ethnicity Data for 1790-2010 for U.S. States and Counties (the 2010 data is only for subscribers)
- United States Race and Ethnicity Data for 2000 and 2010 for U.S. States and Counties
Future population projections, including by race and/or ethnicity
- Canada Population Projections for 2006-2031
- Israel Population Projections for 2009-2059
- Israel Population Projections for 2015-2035
- New Zealand Population Projections for 2006-2026
- United States Population Projections for 2015-2060
 |
Categories: [Race (human categorization)] [Ethnicity]
↧ Download as ZWI file | Last modified: 05/08/2025 20:52:38 | 15 views
☰ Source: https://handwiki.org/wiki/Social:Race_and_ethnicity_in_censuses | License: CC BY-SA 3.0

 KSF
KSF