American Economic History
 From Conservapedia
 American economic history is the study of the growth and development of the American economy from colonial times to the present.
Contents
Colonial era[edit]
New England[edit]
Economically, New England fulfilled the expectations of its founders. Unlike the cash-crop oriented plantations of the Chesapeake region, the Yankee economy was based on the efforts of individual farmers, who harvested enough crops to feed themselves and their families and to trade for goods they could not produce themselves. The economic standard of living was higher in New England than in the Chesapeake. Poverty was solved when town leaders in New England rented out impoverished families for a year to anyone who could afford to board them, as a form of alms and as a form of cheap labor. Along with farming growth, New England became an important mercantile and shipbuilding center, often serving as the hub for trading between the South and Europe.
Middle colonies[edit]
Chesapeake[edit]
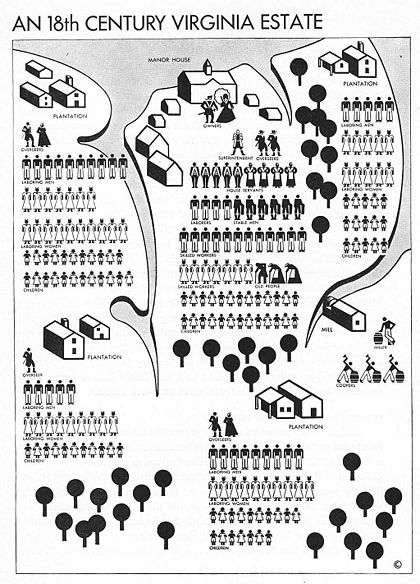
The slave plantations of Virginia and Maryland grew tobacco for export, as well as wheat and horses.
see Plantation
Trade and manufacturing[edit]
The policy of mercantilism guided London—that is, everything that helped the mother country was encouraged, trade with other empires was forbidden, and competition from the colonies was discouraged.[1] British exports to the colonies soared by 360% between 1740 and 1770 as the Americans grew rapidly in both numbers and per-capita wealth. Homespun gave way to ready-made clothing; tin plates gave way to china; empty kegs gave way to polished furniture. American merchants operated import-and-export businesses from every seaport, and built empire-wide ties; often they placed sons or nephews in London or in the West Indies. British merchants funded the exports, which often were carried in American ships.
Britain saw the colonies as a source of raw materials and as a market for goods made in Britain. It did not want the Americans to manufacture items that would compete with it (small items made for local use were tolerated). In order to monopolize the trade, British merchants convinced London to enact a series of laws and regulations to slow or stop the growth of manufacturing. However the colonies had the entrepreneurs, the workers, the raw materials, and the local market that made manufacturing attractive, especially in areas or times of year with little farm work.[2]
The Board of Trade in London instructed royal governors to restrict manufactures; the Board was usually ignored. Tariffs on British products, which would have raised prices on imports and given an advantage to American factories, were forbidden in 1724 by the king's Privy Council (the cabinet). When British woolen manufacturers demanded it in 1699, a law was passed that forbade the export of wool, raw or manufactured, from any colony, although it did not forbid local sales.
Thousands of beaver hats were made in New York and New England, using the product of fur trappers. The Hat Act of 1732 ordered that no American-made hats could be exported from any colony, that no one could engage in hat-making who had not served an apprenticeship of seven years (presumably in Britain), and that no hat-maker could have more than two apprentices. The Iron Act of 1750 tried to stop the opening of slitting mills, iron furnaces, and plating mills in the colonies. However, it also encouraged the production of colonial pig iron and bar iron when such raw materials were imported into Britain.
Wealth and income[edit]
The great majority of people throughout the colonial era were farmers and their income was not cash but the value of the crops and animals produced on farms, and mostly consumed by the family. The estimates are based on inventories of estates when people died. Most people lived in poverty—with very few possessions such as a small stock of clothes, a shack to live in, a few household goods—and land and animals. In terms of wealth the per capita wealth of Americans in 1774 was £37.4 ($6700 in 2009 dollars); per adult male £172 ($30,700); and per white adult male £218 ($39,000).[3]
1776 to 1840[edit]

1840 to 1900[edit]
1900 to 1945[edit]
Transitions: from farming to manufacturing to services[edit]
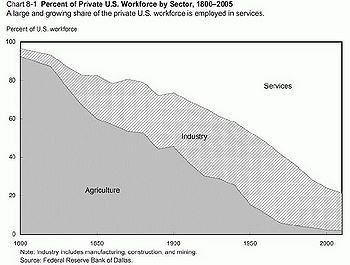
The economy was based on farming before about 1879; manufacturing was the dominant sector from the 1870s to the 1960s. Since then services are the leading sector.
Wage rates rose steadily until the 1970s. Officer (2009) reports that average hourly compensation for factory workers adjusted for inflation increased from $0.71 in 1800 to $26.00 in 2006 (both measured in 2008 prices), a nearly 37-fold increase. Growth was somewhat slower in the nineteenth century, and accelerated after 1900, but the series then leveled off in the 1980s, and remained essentially flat until the early 2000s.[4]
Prosperity: 1945-73[edit]
Deregulation: 1974-1992[edit]
The deregulation movement began when Nixon left office and was a bipartisan operation under Ford, Carter and Reagan. Most important were the removals of New Deal regulations from energy, communications, transportation and banking. The hasty removal of regulation of Savings and Loans while keeping federal insurance led to the Savings and Loan crisis which cost the government an estimated $160 billion.
In 1981, Ronald Reagan introduced fiscally-expansive economic policies, cutting marginal federal income tax rates by 25%. Inflation dropped dramatically from 13.5% annually in 1980 to just 3% annually in 1983 due to a short recession and the Federal Reserve Chairman Paul Volker's tighter control of the money supply and interest rates. Real GDP began to grow after contracting in 1980 and 1982. The unemployment rate continued to rise to a peak of 10.8% by late 1982, but then dropped as sharply as it had risen to a level of 5.4% at the end of Reagan's presidency in January 1989. Critics of the Reagan Administration often point to the fact that the gap between those in the upper socioeconomic levels and those in the lower socioeconomic levels increased during Reagan's presidency; they also note that the federal debt spawned by his policies tripled (from $930 billion on December 31, 1981 to $2.6 trillion on September 30, 1988), reaching record levels. Every president in the later half of the 20th century before Reagan reduced debt as a share of GDP. In addition to the fiscal deficits, the U.S. started to have large trade deficits. Also it was during his second term that the Tax Reform Act of 1986 was passed. In 1987, the stock market lost 22% of its value on Black Monday.
Vice President George H. W. Bush was elected to succeed Reagan in 1988 in a pro-business platform. The early Bush Presidency's economic policies were essentially a continuation of Reagan's policies, but in the early 1990s, Bush went back on a promise and increased taxes in a compromise with Congressional Democrats. He ended his presidency on a moderate note, signing regulatory bills such as the Americans With Disabilities Act, a mandate stating that toilets use low amounts of water, and negotiating the North American Free Trade Agreement. In 1992, Bush and third-party candidate Ross Perot lost to Democrat Bill Clinton.
In late 1988 the private equity firm Kohlberg Kravis Roberts and Company paid $25 billion for RJR Nabisco, still the highest amount ever paid in a leveraged buyout.[5]
Inequality[edit]
The advent of deindustrialization in the late 1960s and early 1970s saw income inequality increase dramatically to levels typical of the pre-1940s (that is pre New Deal era). In 1968, the U.S.' Gini coefficient was 0.386, about equivalent to that of contemporary Japan (.381), though still above that of the United Kingdom (.368) and Canada (.331). However, in the years since deregulation and globalization have allowed U.S. companies to begin to shift their manufacturing and heavy industrial operations to second- and third-world countries with lower labor costs, income inequality in the U.S. has risen dramatically. In 2005, the American Gini coefficient had reached 0.469silimar to that of China (.440). Liberal and leftist critics of economic policies favored by Republican and Democratic administrations since the 1960s, particularly those expanding "free trade" and "open markets" say that these policies, though benefiting other nations as well as the cost of products in the U.S., have taken their own heavy toll on the prosperity of the American working class.
1990s[edit]
The 1990s saw the best economic performance in the United States in three decades. Strong economic growth and falling unemployment were accompanied by low inflation and rising budget surpluses. Although personal bankruptcies climbed, the personal saving rate fell, and the trade deficit expanded, overall, U.S. economic performance during the 1990s was outstanding. During the 1990s, the national debt increased by 75%, GDP rose by 69%, and the stock market as measured by the S&P 500 grew more than three-fold. Inflation was manageable and unemployment dropped to below 5%, resulting in a soaring stock market known as the Dot-com bubble.
In 1994 President Bill Clinton, with Republican support passed a welfare reform program that in part rolled back the liberalism of the New Deal welfare state.
The second half of the 1990s was characterized by "Initial Public Offerings" of High-tech and "dotcom" companies. By 2000, however, it was evident a bubble in stock valuations was bursting; the stock market gave back some 50% to 75% of the growth of the 1990s. The economy worsened in 2001 with output increasing only 0.3% and unemployment and business failures rising substantially, and triggering a recession that is often blamed on the 9-11 Attacks.
Crash of 2008[edit]
see also
The 21st century was prosperous until 2006, as millions of households cashed in the equity in their houses (by refinancing mortgages), to fuel a "bubble" that burst in 2007. By 2006 escalating housing prices leveled off and started to decline, as new housing starts sharply fell. Even more serious trouble arose in the mortgage market. Hundreds of billions of dollars in "sup-prime" mortgages (made to people with mediocre or poor credit records) turned sour in 2007. Major financial institutions across the world had purchased financial instruments based on these mortgages, and lost over $100 billions; many top executives were forced to quit. Widespread concerns about an approaching recession led to stimulus package in which taxpayers received a refund of $600 in spring 2008. In the summer commodity prices hit record highs, then plunged downward, including oil, which reached $4.50 a gallon then dropped to $1.50.
The crisis spiraled down rapidly in September, as major financial institutions collapsed. One of the largest, Lehman brothers with $690 billion in assets went bankrupt, and pushed all the world's leading private banks into a very cautious policy that involved very little lending. It was a liquidity crisis never seen since 1933, as other leading forms collapsed. Led by Secretary of Paulson Henry Paulson and Federal Reserve Chairman Ben Bernanke, the Bush Administrations obtained $700 billion from Congress in October to prevent another Great Depression; the rescue program is called TARP (Troubled Asset Relief Program). The US government provided about $7 trillion in aid and loan guarantees to financial institutions (compared to a GDP of $15 trillion). Many major forms were merged or given large bailouts. The government took over the #1 insurance company AIG and the #1 and #2 mortgage firms, Fanny Mae and Freddy Mac. The #4 and $6 largest banks, Wachovia and Washington Mutual, were forced to merge with larger banks, and the #1 bank Citibank received $300 billion in aid. Finally the Treasury invested tens of billions of cash in the largest banks to keep them solvent.
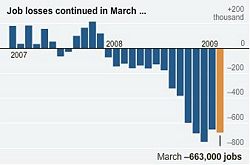
The economy, however, continued to spiral downward late in the year, with severe declines spreading from housing and construction to retail spending and automobiles. Unemployment rose steadily as large corporations, small businesses and ordinary families cut back on their spending. At year's end the automobile industry, especially General Motors and Chrysler verged on bankruptcy. Republicans in Congress blocked a Bush administration plan for $14 billion in emergency auto aid. Bush said on Dec. 12, "A precipitous collapse of this industry would have a severe impact on our economy, and it would be irresponsible to further weaken and destabilize our economy at this time," so he planned to use remaining TARP funds to rescue GM and Chrysler.
See also[edit]
External links[edit]
- "Purchasing Power of Money in the United States from 1774 to 2008", translates the value of a dollar in one year to the value today or any year
Bibliography[edit]
Surveys and textbooks[edit]
- EH.Net Encyclopedia, a highly recommended free on-line encyclopedia of economic history.
- Bruchey, Stuart. Growth of the Modern American Economy (1975), brief. online edition
- Dewey, Davis Rich. Financial History of the United States (1922), standard textbook by a conservative scholar free online edition
- Faulkner, Harold Underwood. American Economic History (1924), an old textbook that is still reliable. online edition
- Hughes, Jonathan, and Louis P. Cain. American Economic History (7th Edition 2006)
- Johnson, Emory R. et al. History of Domestic and Foreign Commerce of the United States (1915), old but detailed and useful vol 1 online free
- Lee, Susan Previant, and Peter Passell. A New Economic View of American History (1979), summarizes the "new economic history"
- Olson, James S. Encyclopedia of the Industrial Revolution in America (2001)
- Porter, Glenn, ed. Encyclopedia of American Economic History (3 vol 1980)
- Weiss, Thomas, and Donald Schaefer; American Economic Development in Historical Perspective (1994) online edition
Colonial era[edit]
- Andrews, Charles M. "Colonial Commerce," American Historical Review, 20#1 (October 1914) pp. 43–63 online
- Bruce, Philip A. Economic History of Virginia in the Seventeenth Century: An Inquiry into the Material Condition of the People, Based on Original and Contemporaneous Records. (1896), very old fashioned history online edition
- Clark, Victor S. History of Manufactures in the United States: 1607-1860 (1916) online at books.google.com
- Engerman, Stanley L., and Robert E. Gallman (eds.), The Cambridge Economic History of the United States: Volume I, The Colonial Era (1996), advanced articles by experts
- Kulikoff, Allan. From British Peasants to Colonial American Farmers (2000) online edition
- McCusker, John J. ed. Economy of British America, 1607-1789 (1991), 540pp, highly influential standard scholarly survey
- Weeden, William Babcock. Economic and Social History of New England, 1620-1789 (1891) 964 pages; [1]
Early national 1776-1860[edit]
- Clark, Victor S. History of Manufactures in the United States: 1607-1860 (1916) online at books.google.com
- Nettels, Curtis. The Emergence of a National Economy, 1775-1815 (1962)
- Taylor, George Rogers. The Transportation Revolution, 1815-1860 (1951)
Industries[edit]
- Chandler, Alfred. The Visible Hand. (1977) famous history of oil, steel and autos 1880-1930
- Copeland, Melvin Thomas. The Cotton Manufacturing Industry of the United States (1912) ch 1. online
- Misa, Thomas. A Nation Of Steel: The Making of Modem America, 1865-1925. (1995) excerpt and text search
Regional[edit]
- Black, John D. The Rural Economy of New England: A regional study (1950) online edition
- Weeden, William Babcock. Economic and Social History of New England, 1620-1789 (1891) 964 pages; online edition
Primary sources[edit]
- Phillips, Ulrich B. ed. Plantation and Frontier Documents, 1649-1863; Illustrative of Industrial History in the Colonial and Antebellum South: Collected from MSS. and Other Rare Sources. 2 Volumes. (1909). online vol 1 and online vol 2
- Schmidt, Louis Bernard. ed. Readings in the economic history of American agriculture (1925) online edition
notes[edit]
- ↑ George Louis Beer, "British Colonial Policy, 1754-1765," Political Science Quarterly, vol 22 (March 1907) pp 1-48; online edition
- ↑ Curtis Putnam Nettels, "The menace of colonial manufacturing, 1690-1720." New England Quarterly, 4 (1931), 230-69
- ↑ Alice Hanson Jones, Wealth of a Nation to Be (1980)
- ↑ Lawrence H. Officer, Two Centuries of Compensation for U.S. Production Workers in Manufacturing (2009)
- ↑ see NY Times report on the RJR Nabisco buyout
Categories: [Business] [Economic History] [United States History]
↧ Download as ZWI file | Last modified: 02/08/2023 13:28:38 | 75 views
☰ Source: https://www.conservapedia.com/American_economic_history | License: CC BY-SA 3.0
 ZWI signed:


 KSF
KSF