Environmental Policy Disputes In The 2016 Elections
 From Ballotpedia
| Ballotpedia's Election Analysis |
|---|
| FEDERAL |
| Battleground elections: |
| U.S. Senate • U.S. House |
| STATE |
| State legislatures • Gubernatorial State Attorney General |
| LOCAL |
| Municipal • School boards Local courts • Local measures |
| PUBLIC POLICY |
| Budget • Education • Election • Energy • Healthcare • Environment |
| Terms and Concepts |
| Partisan Risk |
This page summarizes some of the key environmental policy issues debated in 2016, as well as the stances of political parties and presidential candidates on these issues. In addition, this page identifies relevant state and local ballot measures. Click on the tabs below to learn more.
Major issues[edit]
Summary[edit]
Much of the debate over environmental policy in the election was centered on the EPA's activities under the Obama administration. Beginning in 2009, the Obama EPA took regulatory action in three areas: climate change, air quality, and water quality.
The table below shows how each state stood on the three EPA regulatory actions that were challenged in court: the Clean Power Plan, the Waters of the United States rule, and mercury and air toxics standards for power plants. These states either filed or joined lawsuits challenging the regulations or filed petitions in support of the regulations, while other states had not taken an official position.[1][2][3][4]
| Support for and opposition to EPA regulations challenged in federal court (as of November 2016) | |||
|---|---|---|---|
| State | Clean Power Plan | Waters of the United States rule | Mercury standards |
| Alabama | Opposed | Opposed | Opposed |
| Alaska | No stance | Opposed | Opposed |
| Arizona | Opposed | Opposed | Opposed |
| Arkansas | Opposed | Opposed | Opposed |
| California | Supported | No stance | Supported |
| Colorado | Opposed | Opposed | No stance |
| Connecticut | Supported | Supported | Supported |
| Delaware | Supported | No stance | Supported |
| Florida | Opposed | Opposed | No stance |
| Georgia | Opposed | Opposed | No stance |
| Hawaii | Supported | Supported | No stance |
| Idaho | No stance | Opposed | Opposed |
| Illinois | Supported | No stance | Supported |
| Indiana | Opposed | Opposed | Opposed |
| Iowa | Supported | No stance | Split stance |
| Kansas | Opposed | Opposed | Opposed |
| Kentucky | Opposed | Opposed | Opposed |
| Louisiana | Opposed | Opposed | No stance |
| Maine | Supported | No stance | Supported |
| Maryland | Supported | No stance | Supported |
| Massachusetts | Supported | Supported | Supported |
| Michigan | Opposed | Opposed | Opposed |
| Minnesota | Supported | No stance | Supported |
| Mississippi | Opposed | Opposed | Opposed |
| Missouri | Opposed | Opposed | Opposed |
| Montana | Opposed | Opposed | No stance |
| Nebraska | Opposed | Opposed | Opposed |
| Nevada | No stance | Opposed | No stance |
| New Hampshire | Supported | No stance | Supported |
| New Jersey | Opposed | No stance | No stance |
| New Mexico | Supported | Opposed | Supported |
| New York | Supported | Supported | Supported |
| North Carolina | Opposed | Opposed | Supported |
| North Dakota | Opposed | Opposed | Opposed |
| Ohio | Opposed | Opposed | Opposed |
| Oklahoma | Opposed | Opposed | Opposed |
| Oregon | Supported | Supported | Supported |
| Pennsylvania | No stance | No stance | No stance |
| Rhode Island | Supported | No stance | Supported |
| South Carolina | Opposed | Opposed | Opposed |
| South Dakota | Opposed | Opposed | No stance |
| Tennessee | No stance | Opposed | No stance |
| Texas | Opposed | Opposed | Opposed |
| Utah | Opposed | Opposed | Opposed |
| Vermont | Supported | Supported | Supported |
| Virginia | Supported | No stance | No stance |
| Washington | Supported | Supported | No stance |
| West Virginia | Opposed | Opposed | Opposed |
| Wisconsin | Opposed | Opposed | No stance |
| Wyoming | Opposed | Opposed | Opposed |
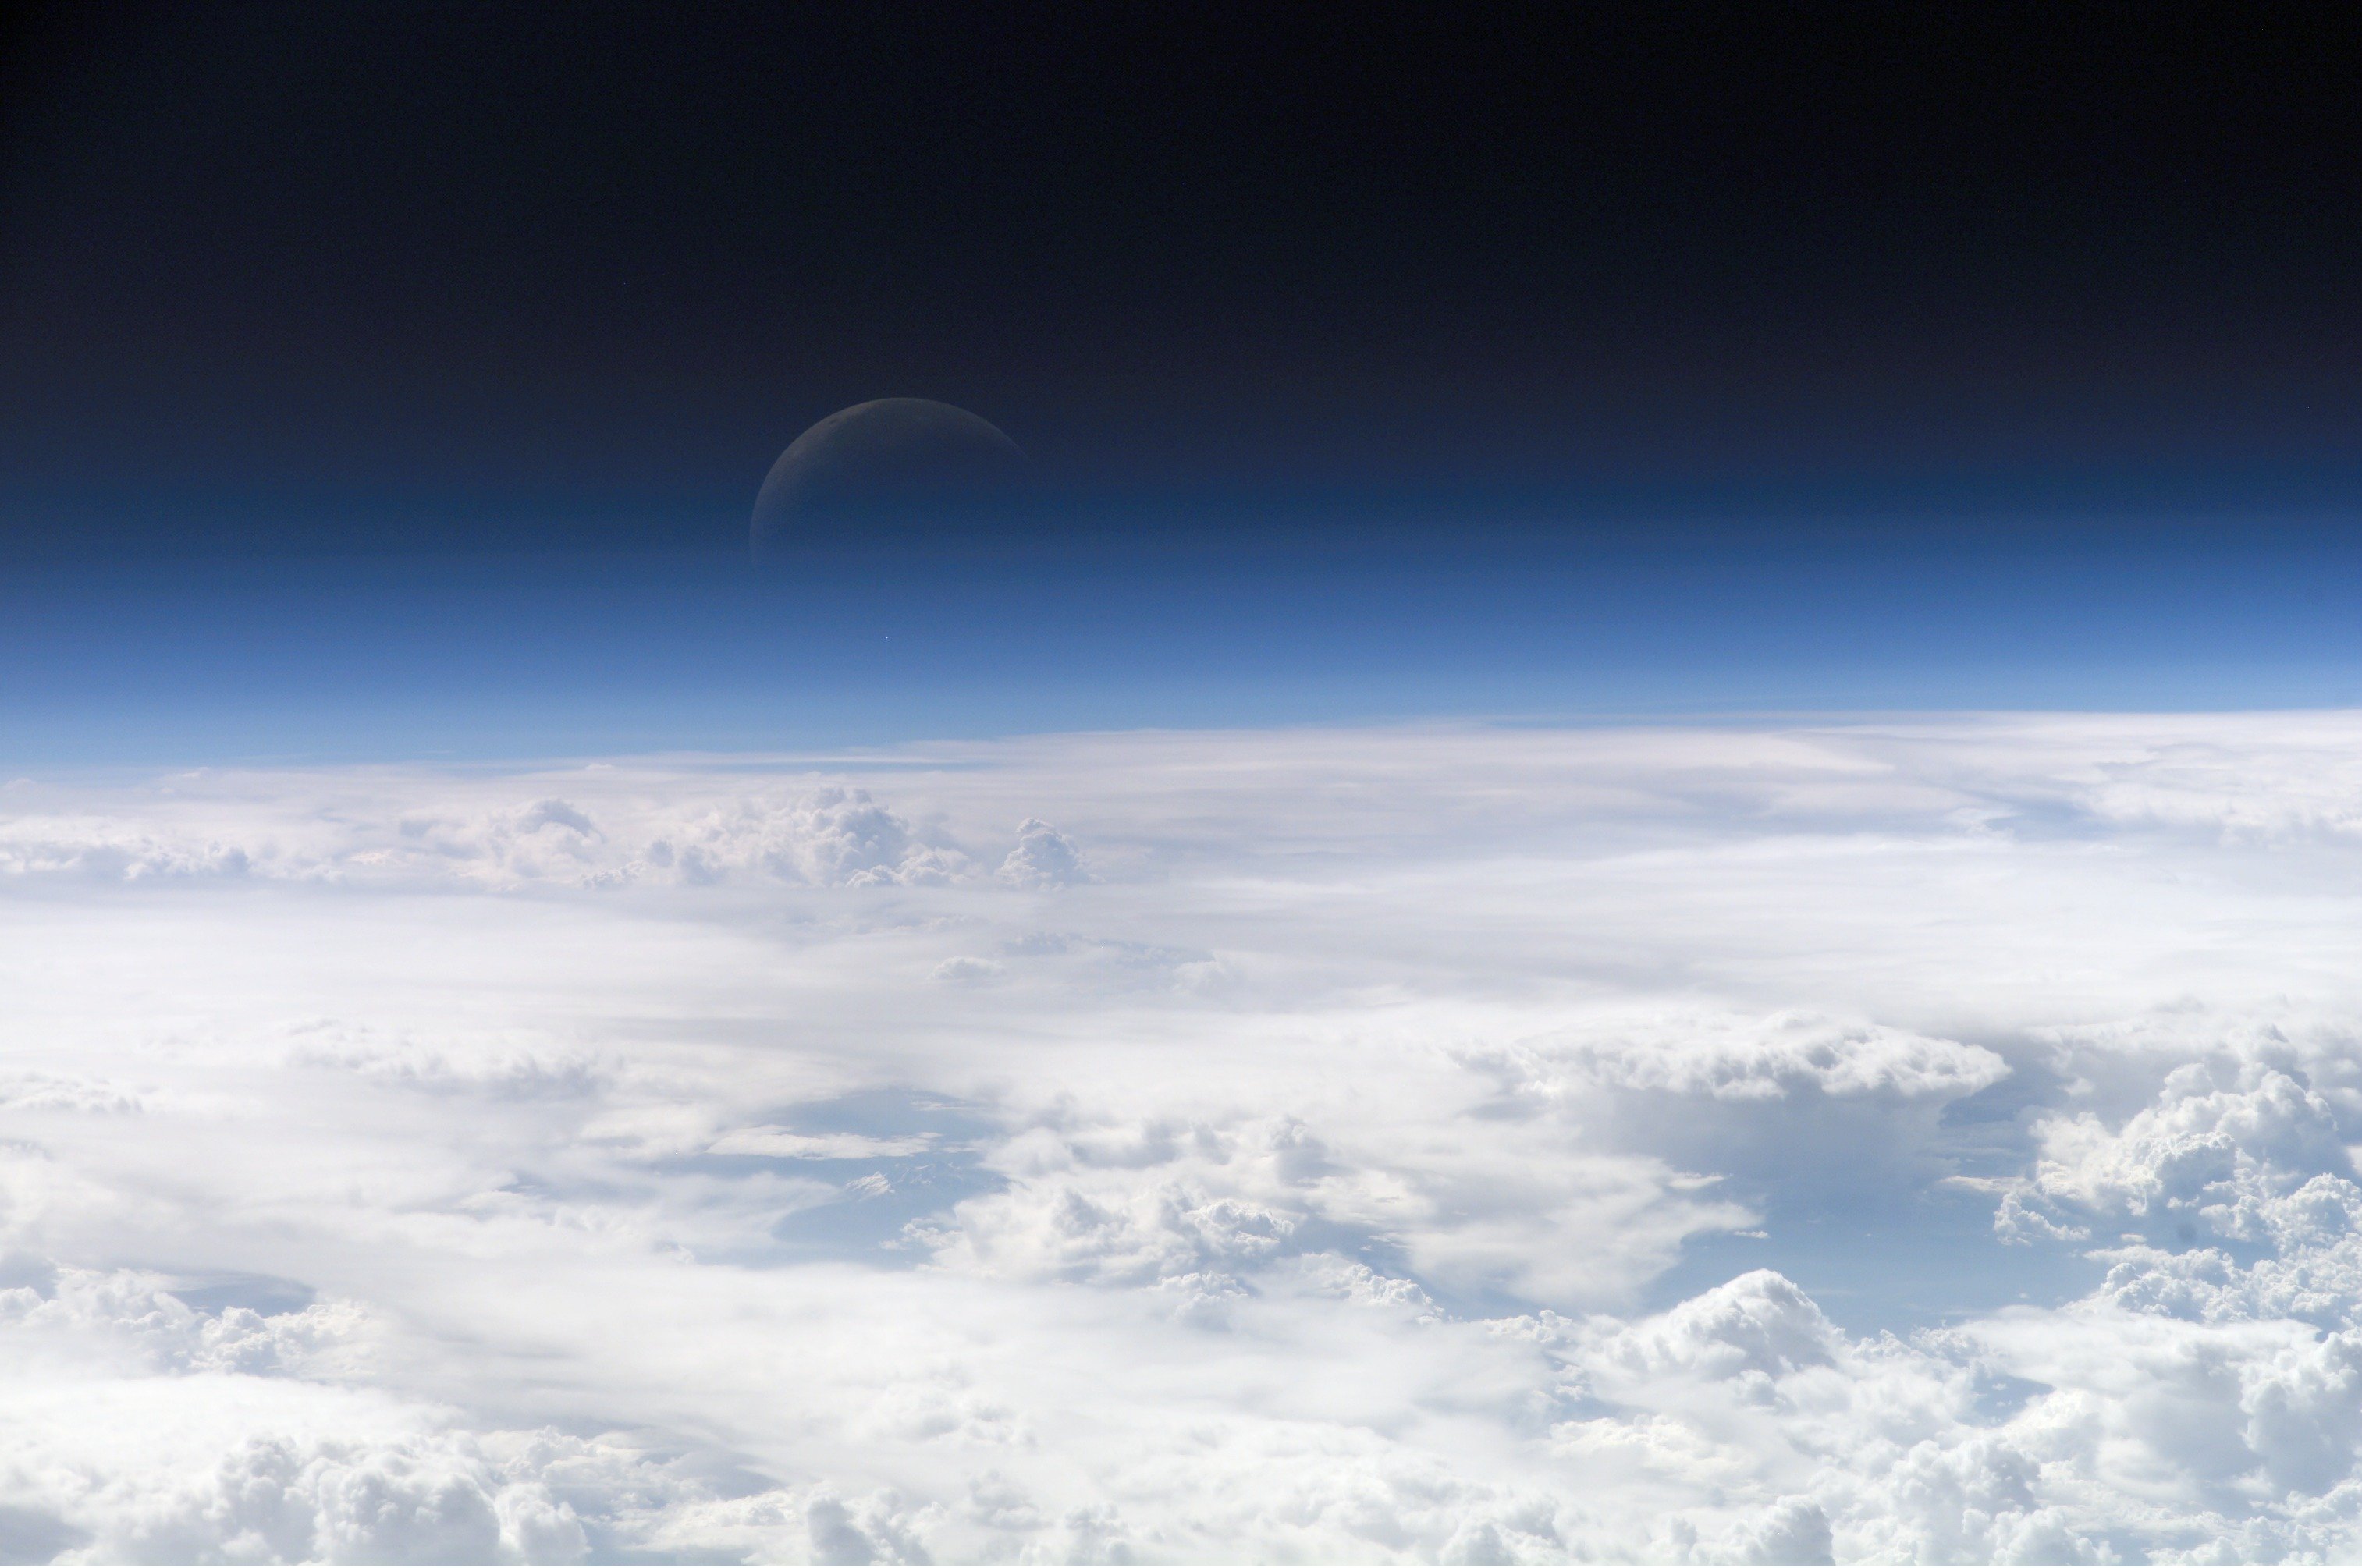
Climate change[edit]
Climate change refers to a significant change in surface and ocean temperatures, precipitation, storm and wind patterns, and other phenomena, usually over a long period of time. Natural activity, such as volcanoes and oceans, as well as human activity, particularly the use of oil and coal, releases carbon dioxide and greenhouse gases into the atmosphere. These naturally occurring gases trap heat in the atmosphere, warming the planet. Some scientists have argued that human-caused greenhouse gases in the atmosphere have reached concentrations higher than those that would occur naturally. These scientists have argued that these gases contribute to global warming and subsequent climate change. Some scientists have argued that the effects of human-made global warming over the next century could lead to higher sea levels, stronger and more frequent weather events, such as hurricanes and droughts, melting of polar ice caps, more acidic oceans, and increased flooding. Other scientists have argued that computer models showing the impact of human activity on climate change may not accurately represent all aspects of global climate and that the precise impact of human-generated greenhouse gases on climate change is not easily calculated, given other potential contributors to climate change, such as solar activity, and the absorption of greenhouse gases by forests and plants.[5][6]
Climate change has been a major policy issue since the early 1990s, particularly with the 1997 Kyoto Protocol, an international treaty that committed signatory countries to reducing their greenhouse gas emissions in an effort to mitigate the potential impacts of human-made climate change. Since the 1990s, climate change has become a partisan issue, as it raises questions about the role of government, the short- and long-term costs and benefits of immediate government action, and how best to balance affordable energy and economic growth with environmental protection and public health. Climate change policies have focused primarily on reducing greenhouse gas emissions in the energy sector, especially in power plants that use oil and coal, and the transportation sector. Other policies have focused on incentives or subsidies for renewable energy sources, such as solar and wind power, which produce fewer emissions.[7][8][9]
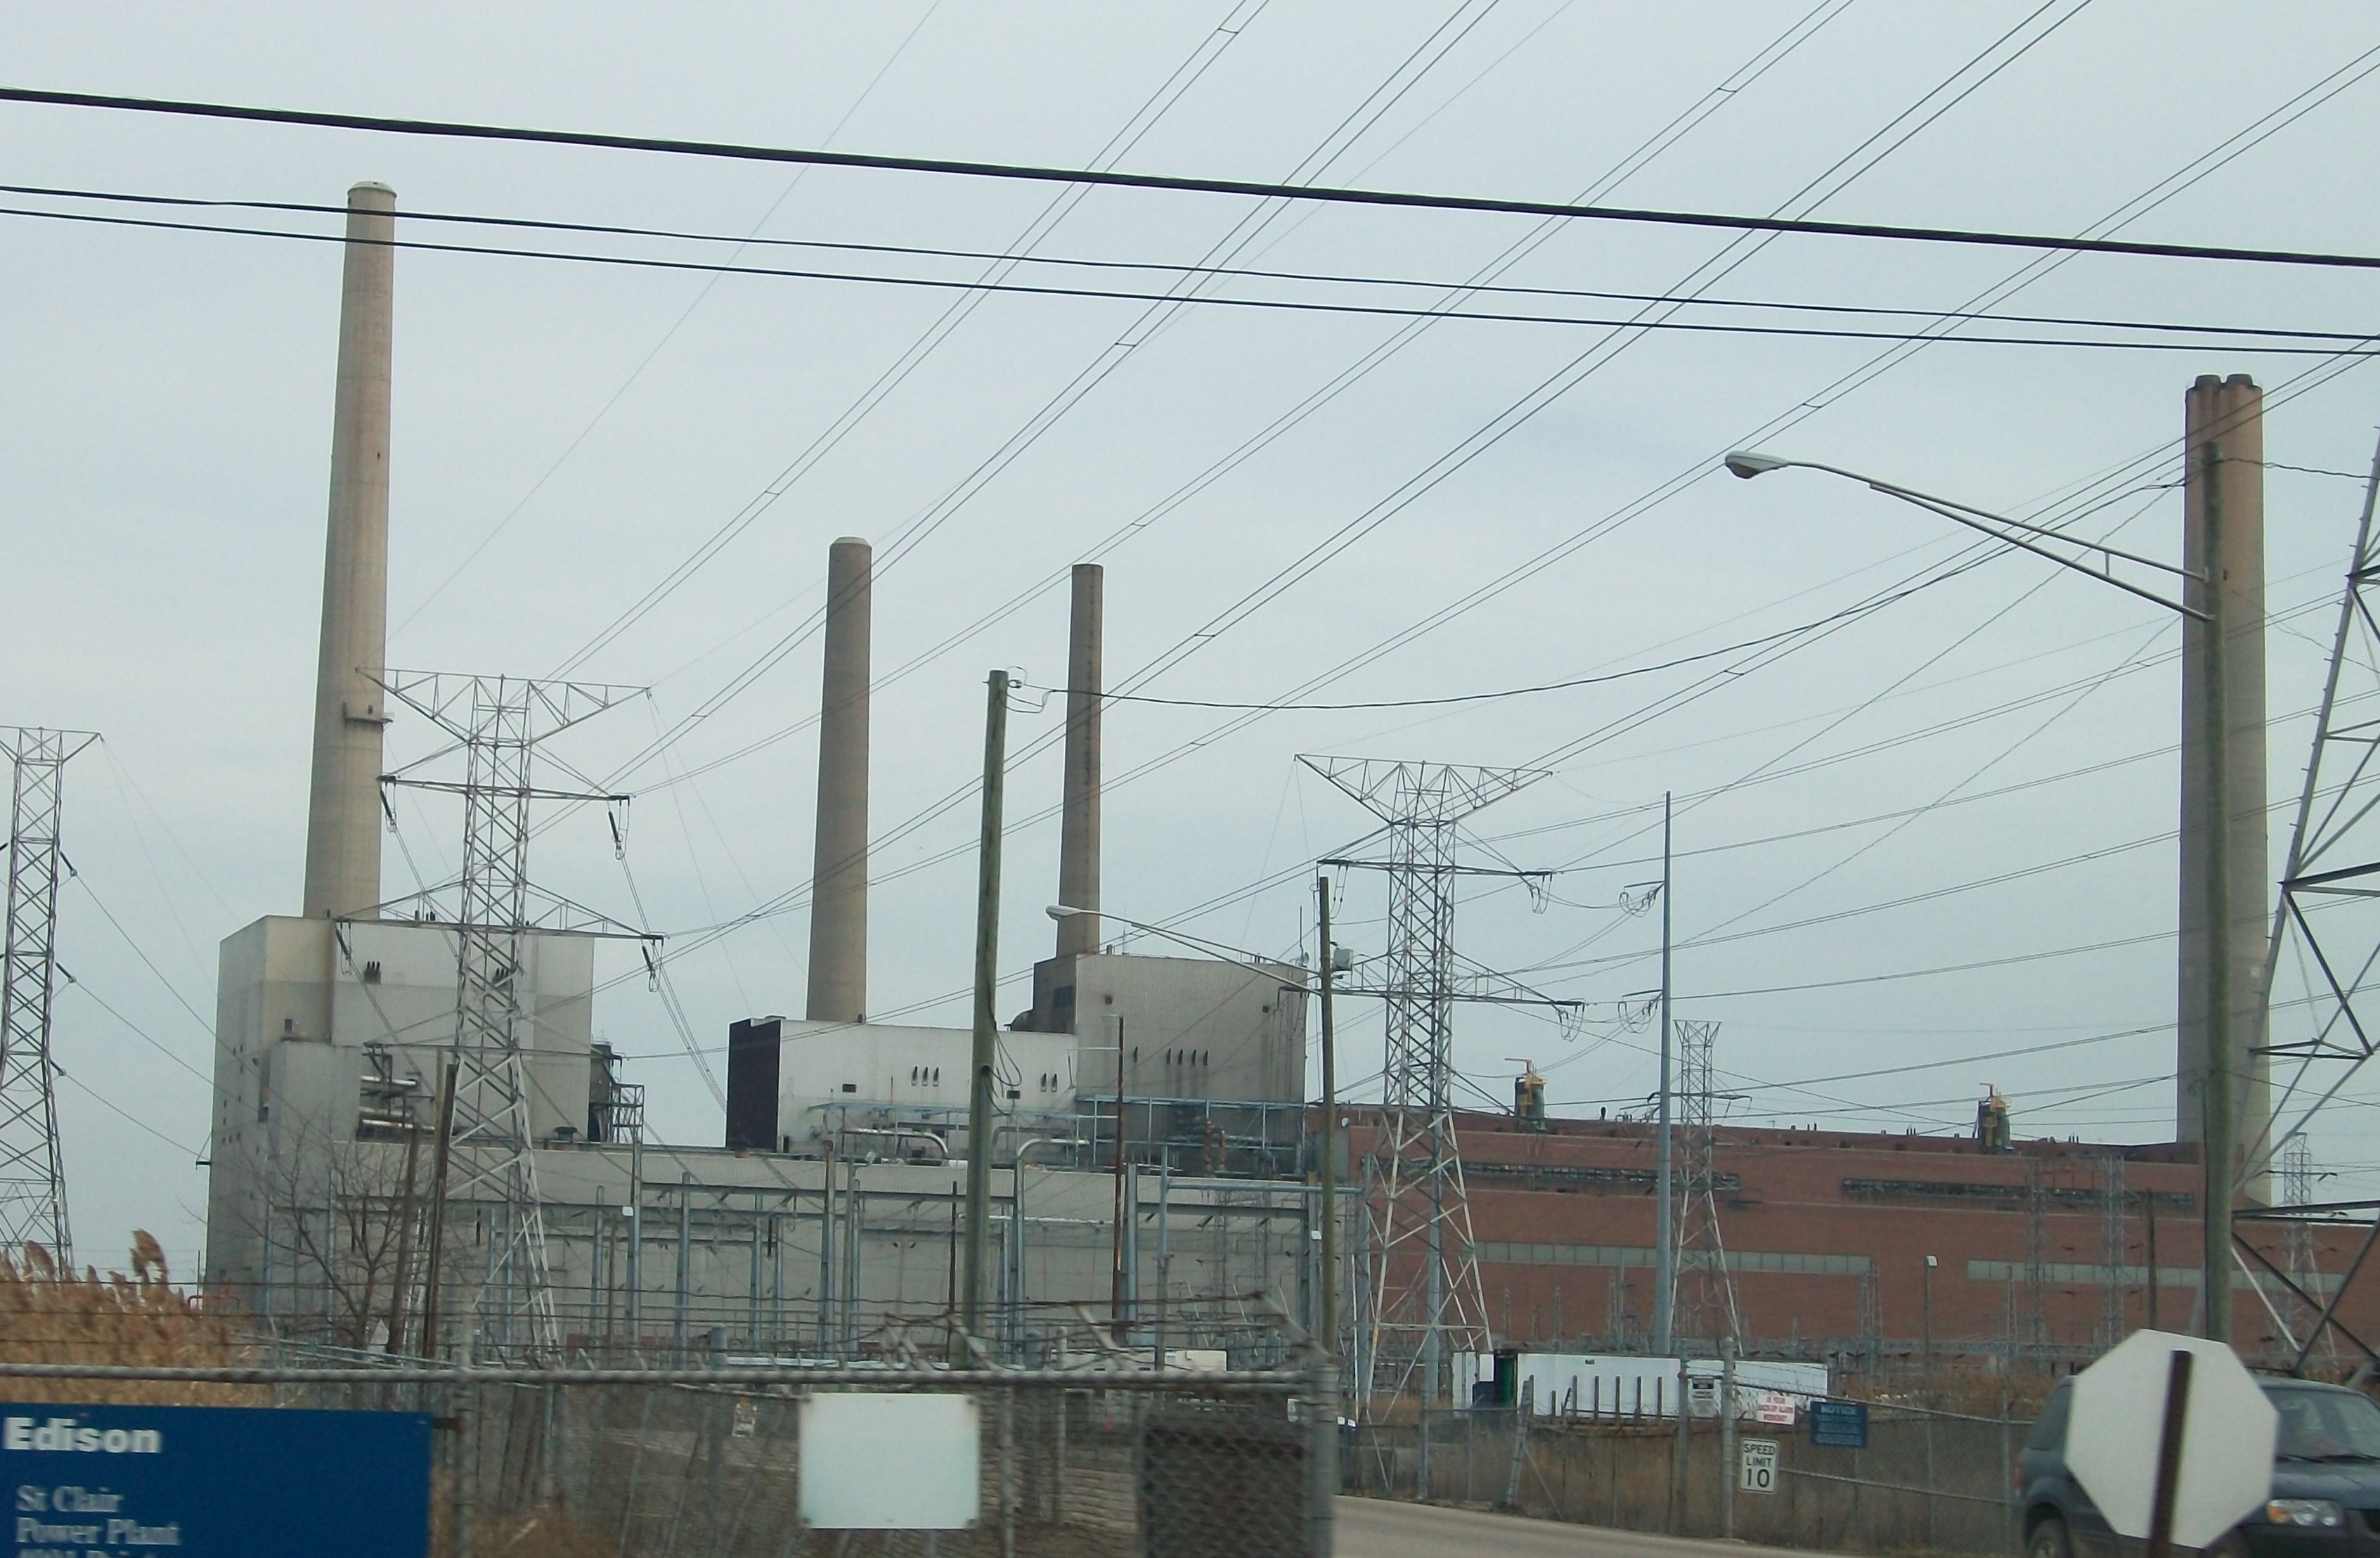
Clean Power Plan[edit]
The outcome of the 2016 election stood to affect the Obama administration's major regulatory action on climate change—the Clean Power Plan. The plan's goal was to reduce carbon dioxide (CO2) emissions from coal- and oil-fired power plants ("fossil fuel-fired") and natural gas-fired power plants by 32 percent from 2005 levels by the year 2030. Each state was required to meet goals based on the number of fossil fuel- and natural gas-fired plants in the state. As of November 2016, 27 states had challenged the plan's legality in court, while 18 states had filed briefs in support of it.[10][11][12]
The map below shows each state's stance. States in light purple opposed the rule, states in dark purple supported the rule, and states in gray had not joined a lawsuit. States that were listed as opposing the plan were identified as such because they either filed a lawsuit or joined a lawsuit against the plan. Supporting states were those that joined a lawsuit or filed their own suit supporting the implementation of the rule.[13]
In February 2016, the plan's challengers succeeded in temporarily halting its implementation pending the outcome of the legal challenge. By a 5-4 vote, the Supreme Court delayed further EPA action, pending a hearing and ruling by the U.S. Court of Appeals for the D.C. Circuit, which heard the case in September 2016.
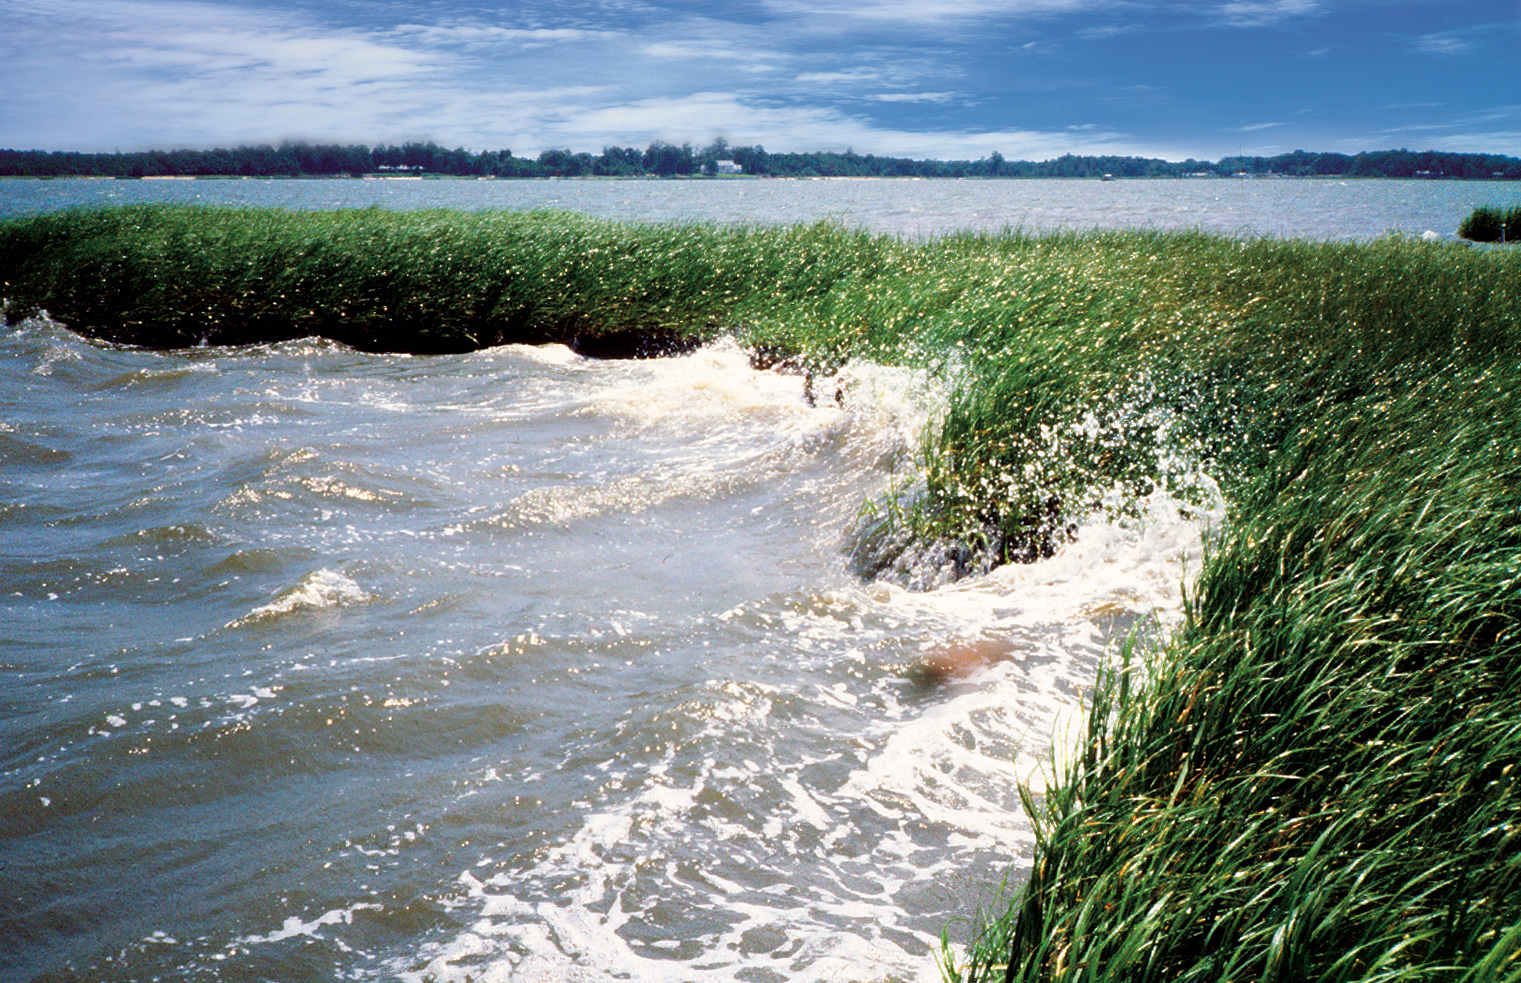
Federal water policy[edit]
In May 2015, the Obama administration expanded federal water policy to include previously unregulated bodies of water. The rule—commonly known as Waters of the United States rule—expanded the EPA's authority under the Clean Water Act over wetlands, streams, tributaries, and other waters in order to protect downstream water quality. Federal permits were required for any private individual, group, or business whose activities could affect these waters. Like the Clean Power Plan, the rule was a partisan issue.[14][15][16][17]
The debate centered on how the rule would increase the power and jurisdiction of the federal government over water. The Obama EPA argued that the plan would increase the number of regulated waters by 3 percent and cost between $162 million and $279 million per year. The rule's supporters argued that it would protect water quality and clarify which bodies of water should be regulated under the Clean Water Act. The rule's opponents argued that it would increase the EPA's power over water and negatively impact property rights, thereby increasing building costs and hindering business growth.[18][19][20][21]
The rule was also challenged in federal court. In October 2015, the United States Court of Appeals for the 6th Circuit blocked the rule's implementation temporarily to decide whether the rule was permissible under federal law. At least 31 states challenged the rule in federal court.[4][22][23]
Drinking water[edit]

After the drinking water crisis in Flint, Michigan, which emerged in late 2015 and early 2016, much attention was paid to the issue of ensuring drinking water quality in the coming decades. Policymakers were faced with the need to repair deteriorating infrastructure in order to maintain water quality, as well as the challenge of keeping those reforms affordable. Estimates varied on the total costs of water system infrastructure needs. The American Water Works Association found that the United States had around 6.1 million lead water lines, although difficulties with record keeping made estimates difficult to calculate. According to the EPA's 2013 national assessment, water infrastructure was in need of $384.2 billion during the 20-year period between 2011 and 2030 in order for water systems to "continue to provide safe drinking water to the public."[24][25][26]
According to the Congressional Budget Office, federal, state, and local government spending on water utilities—water supply and wastewater treatment facilities—totaled $108.9 billion in 2014. This was 26 percent of all federal, state, and local government spending on transportation and water infrastructure, which totaled $416 billion in 2014. Nearly 96 percent of public spending on water utilities—$104.5 billion—came from state and local governments in 2014. Water utilities accounted for 33 percent of state and local government spending in 2014.[27]
The chart below shows federal spending on water utilities compared to state and local spending between 1965 and 2014. After 1965, federal spending on water utilities peaked in 1977 at $16.8 billion and steadily declined to $4.36 billion in 2014—a decrease of 74 percent. By contrast, state and local spending grew steadily after 1977, rising from $38.22 billion to $105.4 billion in 2014—an increase of 175 percent.[27]
Mercury and ozone standards[edit]
The EPA under the Obama administration made federal standards for mercury emissions and ground-level ozone more restrictive. Mercury standards targeted hazardous pollutants from about 585 coal and oil-fired power plants nationwide. As of 2016, the total cost to the power plant sector was estimated at $9.6 billion each year. Ozone standards covered statewide air quality, establishing the acceptable amount of ground-level ozone—commonly known as smog—in the atmosphere, which is formed from the emissions of automobiles, power plants, factories, and manufacturing centers. In 2015, the EPA made the ozone standards more restrictive. They were expected to take effect in 2025, with states having until between 2020 and 2037 to create and establish plans to meet the federal standards.[28][29][30][31]
Federal land policy[edit]

The size and management of federal land was a major issue in 2016, particularly in Western states, where the majority of federal land is located. Federal land policy generally involves the conservation and management of natural resources. Four federal agencies are responsible for 609-610 million acres of federal land, or around 26 percent of all land in the United States. Federal lands are used for conservation, recreation, wildlife protection, grazing, energy production, and other purposes. Ten Western state legislatures looked into the issue of federal land transfers to state governments between 2012 and 2016. Those states argued that vast tracts of federal land put them at an economic disadvantage and left them without control over how those lands were used.[32]
At the 2016 Republican National Convention, the Republican platform committee voted in favor of a provision calling on Congress to pass national legislation that would transfer specific federal lands to state governments to be included in the party's 2016 platform. The provision did not define which federal lands would be included.[33]
Land management policies were debated for their economic, environmental, and social impacts. Rising maintenance costs for federally owned areas sparked debate over the appropriate level of funding for federal land management. Additionally, the size of the federal government's land holdings and its acquisition of additional lands, particularly in the Western United States, were major issues due to their potential impact on state governments and private individuals.[32][34]
As of November 2016, 10 Western state legislatures looked into the issue of federal land transfers. These states included Arizona, Colorado, Idaho, Montana, Nevada, New Mexico, Oregon, Utah, Washington, and Wyoming.[35]
The map below shows the percentage of federal land in each state. Alaska had the most federal land (223.8 million acres) while Nevada had the greatest percentage of federal land within a state (84.9 percent). In contrast, Rhode Island and Connecticut had the fewest acres of federal land: 5,157 acres and 8,752 acres, respectively. Connecticut and Iowa tied for the lowest percentage of federal land at 0.3 percent each.[32]
Endangered species[edit]
The federal Endangered Species Act (ESA) mandates a list of endangered and threatened species and their protection. The legislation is meant to prevent the extinction of vulnerable species throughout the United States and to recover a species' population through conservation programs. The U.S. Fish and Wildlife Service is responsible for the law's implementation. In 2016, there was debate over the proper balance between governmental protection of vulnerable species and the protection of private property rights. Other debated policy issues included the role of science, the costs of listing a species as protected, and the transparency of endangered species policy decisions. Republicans supported revisions to the ESA, while Democrats supported the ESA's implementation without revisions.[31][36]
The map below shows the number of species protected under the Endangered Species Act in each state as of May 2016. The United States had 2,389 species listed under the Endangered Species Act as of May 2016 (this includes the 50 states and does not include species listed in U.S. territories).[37]
Hawaii, California, Alabama, Florida, and Texas had the largest number of federally listed species. Vermont, Rhode Island, Delaware, New Hampshire, and North Dakota had the fewest federally listed species.[37]
National races[edit]
 Democratic Party[edit]
The Democratic Party adopted its 2016 platform at the Democratic National Convention in July 2016.[38]
| The 2016 Democratic Party Platform on environmental policy | |||
|---|---|---|---|
|
 Republican Party[edit]
The Republican Party adopted its 2016 platform at the Republican National Convention in July 2016.[40]
| The 2016 Republican Party Platform on environmental policy | |||
|---|---|---|---|
|
 Libertarian Party[edit]
The Libertarian Party adopted its 2016 platform at the Libertarian National Convention in May 2016.
| The 2016 Libertarian Party Platform on environmental policy | |||
|---|---|---|---|
|
 Green Party[edit]
The Green Party National Committee adopted its 2016 platform in August 2016. The platform's introduction to the section on environmental policy and the section on climate change can be viewed by clicking "show" in the box below.
| The 2016 Green Party Platform on environmental policy | |||
|---|---|---|---|
|
Presidential candidates' stances on the environment[edit]
Hillary Clinton[edit]

Energy development[edit]
- In a December 17, 2015, radio interview with South Carolina radio station WGCV-AM, Hillary Clinton said, “I am very skeptical about the need or desire for us to pursue offshore drilling off the coast of South Carolina, and frankly off the coast of other southeast states.”[43]
Climate change[edit]
- Politico reported on August 11, 2016, that Hillary Clinton had assembled an advisory team on climate change of more than 100 people, including former Environmental Protection Agency Administrator Carol Browner, former Michigan Gov. Jennifer Granholm (D), and many former Obama administration officials.[44]
- According to The Hill, “Clinton is open to working with lawmakers on a tax on carbon dioxide emissions if Congress wants it.” On July 26, 2016, Clinton’s energy advisor Trevor Houser said, “Democrats believe that climate change is too important to wait for climate deniers in Congress to start listening to science. And while it’s always important to remain open to a conversation about how to address this issue with Congress, we need a plan that we can implement day one, because it’s too important to wait, and we need to focus on those things as well.”[45]
- Clinton, on January 18, 2016, signed a pledge to power at least half of the nation's energy needs with renewable sources by 2030. The pledge was created by NextGen Climate, a San Francisco-based environmental advocacy organization that was founded by philanthropist, environmental activist, and Democratic donor Tom Steyer in 2013. The group is affiliated with NextGen Climate Action, a super PAC.[46]
- In response to the Paris Agreement adopted on December 12, 2015, Clinton released the following statement, in part: “I applaud President Obama, Secretary Kerry and our negotiating team for helping deliver a new, ambitious international climate agreement in Paris. This is an historic step forward in meeting one of the greatest challenges of the 21st century—the global crisis of climate change. … We cannot afford to be slowed by the climate skeptics or deterred by the defeatists who doubt America’s ability to meet this challenge.”[47]
- Clinton’s campaign announced on November 11, 2015, a $30 billion plan to benefit coal communities as the nation’s electric grid shifts to cleaner energy sources, Time reported. Clinton’s plan would invest in building roads, bridges, water systems, and airports in Appalachia and other coal areas, expand broadband access, and increase public investment in research and development. She would expand a public works project, according to a campaign white paper, aimed at producing clean energy through hydro power on federal lands. The plan said that as president, Clinton would find ways to replace local revenue for public schools lost when coal production facilities disappear, ensuring that workers at bankrupt coal companies keep their benefits. She would also award grants for efficient housing upgrades and community health centers in coal communities.[48]
- Clinton announced her climate change policy on July 26, 2015. She focused on two national goals: installing more than 500 million solar panels across the country by the end of her first term and generating enough renewable energy to power every home in 10 years. In a video released by her campaign promoting her plan, Clinton said, "It's hard to believe there are people running for president who still refuse to accept the settled science of climate change."[49][50]
- After Clinton released part of her climate change policy, the Republican opposition research organization America Rising criticized her for using a private jet. On July 28, 2015, an aide to Clinton announced that her campaign would be carbon neutral. "We'll be offsetting the carbon footprint of the campaign and that includes travel," the aide said. Clinton previously pledged to run a carbon neutral campaign in 2008.[51]
- In December 2014, Clinton said, “The science of climate change is unforgiving, no matter what the deniers may say, sea levels are rising, ice caps are melting, storms, droughts and wildfires are wreaking havoc.”[52]
Keystone XL Pipeline[edit]
- Hillary Clinton announced on September 22, 2015, that she opposed the Keystone XL pipeline. “I think it is imperative that we look at the Keystone pipeline as what I believe it is -- a distraction from important work we have to do on climate change,” Clinton said. She continued, “And unfortunately from my perspective, one that interferes with our ability to move forward with all the other issues. Therefore I oppose it.”[53][54]
- Clinton declined to take a position on the Keystone XL pipeline on July 27, 2015, citing her involvement in evaluating the project. “No other presidential candidate was secretary of state when this process started, and I put together a very thorough deliberative evidence-based process to evaluate the environmental impact and other considerations of Keystone. As such, I know there is a very careful evaluation continuing and that the final decision is pending to be made by Secretary Kerry and President Obama. Very simply, the evaluation determines whether this pipeline is in our nation’s interest and I’m confident that the pipeline impacts on global greenhouse gas emissions will be a major factor in that decisions, as the president has said. So I will refrain from commenting because I had a leading role in getting that process started and I think we have to let it run its course,” Clinton said.[55]
Fracking[edit]
- During the ninth Democratic debate held in Brooklyn, New York, on April 14, 2016, Hillary Clinton was asked whether she had changed her opinion on fracking. Clinton responded, “No, well, I don’t think I’ve changed my view on what we need to do to go from where we are, where the world is heavily dependent on coal and oil, but principally coal, to where we need to be, which is clean renewable energy, and one of the bridge fuels is natural gas. And so for both economic and environmental and strategic reasons, it was American policy to try to help countries get out from under the constant use of coal, building coal plants all the time, also to get out from under, especially if they were in Europe, the pressure from Russia, which has been incredibly intense. So we did say natural gas is a bridge. We want to cross that bridge as quickly as possible, because in order to deal with climate change, we have got to move as rapidly as we can. That’s why I’ve set big goals. I want to see us deploy a half a billion more solar panels by the end of my first term and enough clean energy to provide electricity to every home in America within 10 years. So I have big, bold goals, but I know in order to get from where we are, where the world is still burning way too much coal, where the world is still too intimidated by countries and providers like Russia, we have got to make a very firm but decisive move in the direction of clean energy.”[56]
- At the seventh Democratic debate on March 6, 2016, Clinton discussed her stance on fracking. She said, “You know, I don’t support it when any locality or any state is against it, number one. I don’t support it when the release of methane or contamination of water is present. I don’t support it — number three — unless we can require that anybody who fracks has to tell us exactly what chemicals they are using. So by the time we get through all of my conditions, I do not think there will be many places in America where fracking will continue to take place. And I think that’s the best approach, because right now, there places where fracking is going on that are not sufficiently regulated. So first, we’ve got to regulate everything that is currently underway, and we have to have a system in place that prevents further fracking unless conditions like the ones that I just mentioned are met.”[57]
- Clinton tweeted on August 18, 2015, her disapproval of Shell being permitted to explore the Arctic for oil. “The Arctic is a unique treasure. Given what we know, it's not worth the risk of drilling,” she wrote.[58]
- At the National Clean Energy Summit, Clinton spoke about the benefits of natural gas and the possibility of exporting it. She also expressed concerns about methane leaks and the need to regulate fracking.[59]
Environmental conservation[edit]
- Clinton voted for S 22 - Omnibus Public Land Management Act of 2009, which sought to designate certain areas as federally protected land.[60]
- In 2003, Clinton voted for an amendment which sought to prevent "consideration of drilling in the Arctic National Wildlife Refuge."[61]
Donald Trump[edit]
- See also: Donald Trump presidential campaign, 2016

- In a speech in Pennsylvania on September 22, 2016, Trump outlined his energy policies. “I’m going to lift the restrictions on American energy and allow this wealth to pour into our communities including right here in the state of Pennsylvania. We will end the war on coal and on miners,” said Trump to attendees of the 2016 Shale Insight Conference, a gathering of natural gas producers. He said, “Billions of dollars in private infrastructure investment have been lost to the Obama-Clinton restriction agenda. … We will streamline the permitting process for all energy infrastructure projects, including the billions of dollars in projects held up by President Obama -– creating countless more jobs in the process.” Trump further outlined that he would roll back Obama's climate change plans, promote oil and gas drilling on federal lands, and promote the construction of oil and gas pipelines.[62]
- During a rally in Fresno, California, on May 27, 2016, Donald Trump said that there was no drought in the state and that officials were prioritizing an endangered fish, the Delta smelt, with its water restrictions. “We’re going to solve your water problem. You have a water problem that is so insane. It is so ridiculous where they’re taking the water and shoving it out to sea,” he said.[63]
- Donald Trump's campaign asked U.S. Rep. Kevin Cramer (R-N.D.) to draft a white paper on energy policy. The Huffington Post reported on May 13, 2016, that Cramer “would emphasize the dangers of foreign ownership of U.S. energy assets, burdensome taxes, and over-regulation” in his policy paper.[64]
- On August 24, 2012, Trump tweeted that wind turbines were "an environmental & aesthetic disaster."[65]
- Trump wrote in his 2011 book, Time to Get Tough, that the Marcellus Shale was "one of the largest mother lodes of natural gas" and should be used to buy "more time to innovate and develop newer, more efficient, cleaner, and cheaper forms of energy."[66]
- In a 2011 interview on energy production, Trump said the United States was not yet effectively utilizing nuclear energy, natural gas, or drilling.[67]
Climate change[edit]
- The Trump campaign released a statement on the Paris Climate Accord after it was announced on October 5, 2016, that the international climate change deal would go into effect on November 4, 2016. The Trump campaign said it would “impose enormous costs on American households through higher electricity prices and higher taxes.” The statement went on to say, "As our nation considers these issues, Mr. Trump and Gov. Pence appreciate that many scientists are concerned about greenhouse gas emissions. We need America's scientists to continue studying the scientific issues but without political agendas getting in the way. We also need to be vigilant to defend the interests of the American people in any efforts taken on this front."[68]
- Trump’s campaign manager, Kellyanne Conway, said on September 27, 2016, that Trump believes global warming is naturally occurring and humans are not the cause.[69]
- Responding to a questionnaire published in Scientific American on September 13, 2016, Trump said, “There is still much that needs to be investigated in the field of 'climate change.' Perhaps the best use of our limited financial resources should be in dealing with making sure that every person in the world has clean water. Perhaps we should focus on eliminating lingering diseases around the world like malaria. Perhaps we should focus on efforts to increase food production to keep pace with an ever-growing world population. Perhaps we should be focused on developing energy sources and power production that alleviates the need for dependence on fossil fuels. We must decide on how best to proceed so that we can make lives better, safer and more prosperous.”[70]
- Trump delivered a speech on energy production at an oil and natural gas conference in North Dakota on May 26, 2016. Through the use of untapped domestic oil and gas reserves, Trump said that he would make the U.S. independent from foreign oil providers. If elected, he also pledged to take the following actions in his first 100 days in office: rescind the Climate Action Plan and Waters of the U.S. rule, support the renewal of the Keystone XL Pipeline project, cancel the Paris Climate Agreement, and reform the regulatory environment. The merit of future regulations, Trump said, would be determined by asking, “Is this regulation good for the American worker?”[71][72][73]
- In a January 2014 interview on FOX News, Donald Trump said climate change was a hoax.[74] Two years earlier, Trump tweeted, "The concept of global warming was created by and for the Chinese in order to make U.S. manufacturing non-competitive."[75]
Fracking[edit]
- While campaigning in Colorado Springs, Colo., on July 29, 2016, reporter Brandon Rittiman asked Trump about a fracking ballot measure that would change the state constitution to allow municipalities to ban oil and gas exploration. "Well, I’m in favor of fracking, but I think that voters should have a big say in it,” Trump told the reporter. “I mean, there’s some areas, maybe, they don’t want to have fracking. And I think if the voters are voting for it, that’s up to them… If a municipality or a state wants to ban fracking, I can understand that.”[76]
Keystone XL Pipeline[edit]
- In an interview with Greta Van Sustern on FOX News in January 2012, Trump criticized President Barack Obama's rejection of the Keystone XL pipeline. He said, "Frankly, we don't need Canada. We should just be able to drill our own oil. As long as it's there we certainly should have approved it. It was jobs and cheaper oil. It's just absolutely incredible. I guess President Obama took care of the environmentalists, but it is absolutely terrible. And it is not an environmental problem at all in any way, shape, or form."[77]
Gary Johnson[edit]
- See also: Gary Johnson presidential campaign, 2016
-circle.png)
- In a speech on September 14, 2016, Johnson said, “Government I think has a fundamental responsibility to protect us against those that would do us harm, in this case pollution. And I support the EPA.”[78]
- On his campaign website, Johnson described his approach to environmental policy: "We need to stand firm to protect our environment for our future generations, especially those designated areas of protection like our National Parks. Consistent with that responsibility, the proper role of government is to enforce reasonable environmental protections. Governor Johnson did that as Governor, and would do so as President. Governor Johnson believes the Environmental Protection Agency, when focused on its true mission, plays an important role in keeping the environment and citizens safe. Johnson does not, however, believe the government should be engaging in social and economic engineering for the purpose of creating winners and losers in what should be a robust free market. Preventing a polluter from harming our water or air is one thing. Having politicians in Washington, D.C., acting on behalf of high powered lobbyists, determine the future of clean energy innovation is another. ... In a healthy economy that allows the market to function unimpeded, consumers, innovators, and personal choices will do more to bring about environmental protection and restoration than will government regulations driven by special interests. Too often, when Washington, D.C. gets involved, the winners are those with the political clout to write the rules of the game, and the losers are the people and businesses actually trying to innovate. ... Governors Johnson and Weld strongly believe that the federal government should prevent future harm by focusing on regulations that protect us from real harm, rather than needlessly costing American jobs and freedom in order to pursue a political agenda."[79]
- In a video posted to YouTube in March 2012, Gary Johnson said he opposed the Keystone XL pipeline if eminent domain were necessary to establish it. "If the Keystone pipeline is an issue of eminent domain – no, the government should not get involved or I'd have to really have a look at that. If it's rules and regulations that we're talking about, then, yes, rules and regulations can make and should make and I would support making the Keystone XL pipeline happen."[80]
- On his 2012 presidential campaign website, Johnson wrote, "When it comes to the environment, the Federal government’s responsibility is no different than in other aspects of our lives. It is simply to protect us from those who would do us harm and damage our property. There are bad actors who would pollute our water supplies and our air if allowed to do so, and we must have laws and regulations to protect innocent Americans from the harm those bad actors would do. However, common sense must prevail, and the costs of all regulations must be weighed against the benefits. The government should simply stay out of the business of trying to promote or 'manage' energy development. The marketplace will meet our energy needs in the most economical and efficient manner possible – if government will stay out of the way."[81]
- Johnson said he favored nuclear power in an August 2011 interview.[82]
Climate change[edit]
- In an interview with the Washington Examiner on July 10, 2016, Johnson commented on the EPA and coal industry, saying, "The role, as far as the Environmental Protection Agency, is to identify health or safety concerns with regard to emissions. I think right now what is happening with climate change, what is happening with the coal industry, is that coal has been bankrupted. It has been bankrupted by the free market. As low as the price of coal is today, natural gas is even lower. So, no new coal plants are going to be built ... Those that exist now are being grandfathered in [under the EPA regulations]. So, coal, the number one contributor to CO2 emissions in the world, is dead. Coal is dead. And the free market did it because we, as consumers, are demanding less carbon emissions."[83]
- In an interview with CNBC on August 22, 2016, Johnson said, "I do think that climate change is occurring, that it is man-caused. One of the proposals that I think is a very libertarian proposal, and I'm just open to this, is taxing carbon emission that may have the result of being self-regulating. ... The market will take care of it. I mean, when you look at it from the standpoint of better results, and actually less money to achieve those results, that's what is being professed by a carbon tax."[84]
- On the questions of climate change and whether or not humans contribute to it, Johnson said on his campaign website: "Is the climate changing? Probably so. Is man contributing to that change? Probably so. But the critical question is whether the politicians’ efforts to regulate, tax and manipulate the private sector are cost-effective – or effective at all."[79]
- Johnson said in a December 2011 interview with NPR that although he believed climate change was human-induced, he did not support cap and trade regulations to lower carbon emissions. He said, "You know, I'm accepting that global warming is man-caused. That said, I am opposed to cap and trade. I think that free-market approach. Hey, we're all demanding less carbon emission. I think we're going to get it."[85]
Fracking[edit]
- In November 2011, Johnson said, "I’m going to keep an open mind on fracking.” He continued, saying that "the fact that in Pennsylvania you could turn your faucet on and get water before fracking, and afterwards you could light it — that's a concern. That's a real, live concern.”[86]
Jill Stein[edit]
- See also: Jill Stein presidential campaign, 2016

- On September 7, 2016, warrants were filed in Morton County, North Dakota, for the arrest of Jill Stein and her running mate, Ajamu Baraka, for misdemeanor charges of criminal trespass and criminal mischief. They allegedly vandalized equipment at a construction site to protest the Dakota Access pipeline. Stein called her actions civil disobedience. She added, “I hope the North Dakota authorities press charges against the real vandalism taking place at the Standing Rock Sioux reservation: the bulldozing of sacred burial sites and the unleashing of vicious attack dogs."[87]
- In an interview on Fox Business on August 26, 2016, Stein said, “What the science actually says and the studies and the experts say that if we have the political will, we can convert. And it’s not just a matter of shutting down fossil fuel—it’s a matter of creating the good jobs for the economy of the future that’s healthy for us as people and healthy for the planet. … Fortunately, we save so much money by the health improvements from phasing out fossil fuels—it’s actually enough to pay for those jobs to ensure the green energy transition.”[88]
- Jill Stein tweeted on August 11, 2016, “My attorney general will prosecute Exxon for lying to the world about climate change. We need to end fossil fuels before it's too late.”[89]
- On January 26, 2016, Stein said, "No human being should be condemned to drink water contaminated by a neurotoxin.” Stein called for criminal prosecution of the governor and other public officials who were aware of the water contamination in Flint, Michigan, immediate federal and state intervention to resolve Flint’s water crisis, and federal investment in the nation’s water system.[90]
- In a November 29, 2015, interview with The Harvard Crimson, Stein said she “hopes to replicate key aspects of the New Deal legislation,” which she believes “would allow the US to become fully dependent on renewable energy within 15 years.” She said the plan “revives the economy, creates well paying living wage jobs that we desperately need at the same time that it greens the economy and the energy system and therefore turns the tide on climate change and makes wars for oil obsolete. It’s a win-win.”[91]
- As part of the "Green New Deal" promoted on her 2016 presidential campaign website, Stein supported "transitioning to 100% clean renewable energy by 2030."[92]
- Stein was charged with trespassing when she attempted to provide food to activists protesting the Keystone XL pipeline in October 2012.[93]
- On Stein's 2012 presidential campaign website, she listed five action items she would take to improve the environment.
- "Create millions of green jobs in areas such as weatherization, recycling, public transportation, worker and community owned cooperatives, and energy-efficient infrastructure."[94]
- "Promote conversion to sustainable, nontoxic materials."[94]
- "Promote use of closed-loop, zero waste processes."[94]
- "Promote organic agriculture, permaculture, and sustainable forestry."[94]
Climate change[edit]
- On June 28, 2016, Jill Stein “said that the proposed deal with Mexico and Canada to go to 50% carbon-free electricity from 2025 is inadequate to meet the climate goals set in Paris,” according to a press release from her campaign. Stein said, "Obama's proposals are a step in the right direction but way too little. We need an emergency national mobilization similar to what our country did after Pearl Harbor at the outset of WWII." Stein proposes transitioning “to 100% clean energy for everything - not just electricity – by 2030 while creating 20 million jobs and avoiding hundreds of thousands of annual ‘excess deaths’ from air pollution.”[95]
- During a February 15, 2016, interview with Chris Hedges posted on TheRealNews.com, Stein said, "[W]e are facing an all-out climate emergency."[96]
Fracking[edit]
- After traveling to Paris to participate in events related to the United Nations Climate Change Conference, Stein said in a statement on December 11, 2015, “The voluntary, unenforceable pledges being produced by COP21 are entirely insufficient to prevent catastrophic climate change. Scientific analysis shows that these pledges will lead us to 3 degrees Celsius global temperature rise - and that will be catastrophic." She added that the spread of the hydrofracking industry in the U.S. “is leading to a spreading cancer of polluted groundwater and fracked gas pipelines.”[97]
Ballot measures[edit]
Environmental ballot measures[edit]
Ballotpedia tracked the following environmental ballot measures in 2016.
| Voting on the Environment | ||||
|---|---|---|---|---|

| ||||
| Ballot Measures | ||||
| By state | ||||
| By year | ||||
| Not on ballot | ||||
|
| Voting on Water | ||||
|---|---|---|---|---|
| ||||
| Ballot Measures | ||||
| By state | ||||
| By year | ||||
| Not on ballot | ||||
|
| Voting on Natural Resources |
|---|
|
| Ballot Measures |
| By state |
| By year |
| Not on ballot |
Certified environmental ballot measures[edit]
State ballot measures[edit]
- California Proposition 65, Dedication of Revenue from Disposable Bag Sales to Wildlife Conservation Fund (2016)
A "yes" vote supported redirecting money collected from the sale of carry-out bags by grocery or other retail stores to a special fund administered by the Wildlife Conservation Board. A "no" vote opposed this measure redirecting money collected from the sale of carry-out bags by grocery or other retail stores to a special fund administered by the Wildlife Conservation Board.
Local ballot measures[edit]
- City of Columbus Community Bill of Rights Fracking Ban Initiative Charter Amendment (November 2016)Template:Yesbox.defaultTemplate:Nobox.default
- San Francisco Bay Restoration Authority “Clean and Healthy Bay” Parcel Tax, Measure AA (June 2016)
A "yes" vote was a vote in favor of a parcel tax—a kind of property tax based on units of property rather than assessed value—of $12 per year throughout the nine counties surrounding the San Francisco Bay. A "no" vote was a vote to reject the proposed parcel tax of $12 per year. - Santa Clara County, California, Park Charter Fund Extension, Measure A (June 2016)
A yes vote was a vote in favor of extending the Santa Clara County Park Charter Fund through a transfer from the annual fund every year for fifteen years. A no vote was a vote against extending the Park Charter Fund, allowing it to expire in 2021. - Dunsmuir, California, Water Service Changes, Measure W (November 2016)
A yes vote was a vote in favor of making various changes to the city's water and sewer policies, including prohibiting turning off utility services for nonpayment of bills, making property owners, not tenants, responsible for paying water and sewer bills, and establishing a flat rate for water services. A no vote was a vote against making various changes to the city's water and sewer policies, thereby leaving the city the option of shutting off services if bills go unpaid, allowing tenants, rather than property owners, to be the legally responsible customers for water and sewer services, and leaving the option of higher fee rates for properties with higher consumption. - Siskiyou County, California, Groundwater Extraction Permits, Measure H (November 2016)
A yes vote was a vote in favor of amend the groundwater regulation ordinance to require a groundwater extraction permit for extraction from all groundwater sources intended for out-of-county uses, including sources for which county law did not require a permit and extraction for the purpose of bottling as drinking water. A no vote was a vote against amend the groundwater regulation ordinance, thereby leaving a permit required for only certain defined basins and an exception for water used for bottled drinking water. - Healdsburg, California, Fluoridation of Water Supply, Measure T (November 2016)
A yes vote was a vote in favor of instituting a moratorium on fluoridation of city water until manufacturers of fluoridation chemicals provide information about contaminants of the chemical batch. A no vote was a vote against instituting a moratorium on fluoridation of city water until manufacturers of fluoridation chemicals provide information about contaminants of the chemical batch. - Santa Cruz, California, Water System Charter Amendment, Measure H (November 2016)
A yes vote was a vote in favor of amending the city's charter to allow the city council to use revenue from the water system to get matching funds or grants and to issue debt for capital facilities. A no vote was a vote against amending the city's charter to allow the city council to use revenue from the water system to get matching funds or grants and to issue debt for capital facilities. - Arroyo Grande, California, Authority to Purchase Water from the State Water Project, Measure E (November 2016)
A yes vote was a vote in favor of authorizing the city to purchase supplementary water from the State Water Project during emergencies, as declared by the city council. A no vote was a vote against authorizing the city to purchase supplementary water from the State Water Project during emergencies, as declared by the city council.
Proposed environmental ballot measures[edit]
The following environmental ballot measures did not make the ballot in 2016.
- Colorado Ban on Fracking Amendment (2016)
- Oregon Consumer Packaging Initiative (2016)
- Colorado "Right to a Healthy Environment" Amendment (2016)
- Colorado Public Trust Resources Amendment (2016)
- California "Clean Environment" Initiative (2016)
- California Bottled Water Taxes and Drought Label Initiative (2016)
See also[edit]
- United States Congress elections, 2016
- State executive official elections, 2016
- State legislative elections, 2016
Footnotes[edit]
- ↑ U.S. Supreme Court, "Michigan v. Environmental Protection Agency - Brief for petitioners," accessed October 27, 2016
- ↑ U.S. Supreme Court, "Michigan v. Environmental Protection Agency - Brief in opposition," accessed October 27, 2016
- ↑ Congressional Research Service, "EPA’s Clean Power Plan for Existing Power Plants: Frequently Asked Questions," June 15, 2016
- ↑ 4.0 4.1 Reuters, "Court Places Hold On Clean Water Rule Nationwide," October 9, 2015
- ↑ Intergovernmental Panel on Climate Change, "Climate Change 2014 Synthesis Report Summary for Policymakers," accessed September 13, 2016
- ↑ Heartland Institute, "Why Scientists Disagree About Global Warming: The NIPCC Report on Scientific Consensus," accessed September 12, 2016
- ↑ Center for Climate and Energy Solutions, "Climate Change 101: State Action," January 2011
- ↑ U.S. Environmental Protection Agency, "Climate Change: Basic Information," accessed January 21, 2015
- ↑ U.S. Environmental Protection Agency, "Climate change glossary," accessed February 1, 2015
- ↑ U.S. Environmental Protection Agency, "Overview of the Clean Power Plan," accessed November 3, 2015
- ↑ U.S. Environmental Protection Agency, "Clean Power Plan Toolbox for States," accessed November 3, 2015
- ↑ U.S. Environmental Protection Agency, "Clean Power Plan - Rule Summary," August 3, 2015
- ↑ The New York Times, "Supreme Court Deals Blow to Obama’s Efforts to Regulate Coal Emissions," February 9, 2016
- ↑ U.S. Environmental Protection Agency, "CWA Section 404-Permits to Discharge Dredged or Fill Material," accessed September 22, 2014
- ↑ U.S. Army Corps of Engineers, "U.S. Army Corps of Engineers Jurisdictional Determination Form Instructional Guidebook," May 30, 2007
- ↑ Cornell University Law School, "33 U.S. Code, Section 1362 (Text of the Clean Water Act)," accessed September 22, 2014
- ↑ U.S. Environmental Protection Agency, "33 U.S. Code, Section 1251 (Text of the Clean Water Act)," accessed September 19, 2014
- ↑ Farm Futures, "Groups Release 'Waters of the U.S.' Mapping Tool," September 4, 2014
- ↑ Pacific Legal Foundation, "'Waters of the United States' — the ultimate power grab," November 10, 2014
- ↑ Cite error: Invalid
<ref>tag; no text was provided for refs namedrapanos - ↑ Environment and Energy Publishing News, "Big wins elusive for EPA in Clean Water Act showdowns," August 27, 2014
- ↑ U.S. Environmental Protection Agency, "Clean Water Rule Factsheet," accessed May 28, 2015
- ↑ Washington Post, "North Dakota district court blocks controversial ‘Waters of the United States’ rule (UPDATED)," August 28, 2015
- ↑ Detroit Free Press, "Where are the lead pipes? In many cities, we just don't know," February 28, 2016
- ↑ Brookings Institution, "A surefire strategy to improve water infrastructure in Flint and beyond," March 18, 2016
- ↑ Environmental Protection Agency, "Drinking Water Infrastructure Needs Survey and Assessment Fifth Report to Congress," April 2013
- ↑ 27.0 27.1 Congressional Budget Office, "Public Spending on Transportation and Water Infrastructure, 1956 to 2014," March 2015
- ↑ U.S. Environmental Protection Agency, "Benefits and Costs of Cleaning Up Toxic Air Pollution from Power Plants," accessed February 2, 2016
- ↑ U.S. Environmental Protection Agency, "Mercury and Air Toxics Standards (MATS) - Basic Information," accessed February 2, 2016
- ↑ U.S. Environmental Protection Agency, "Ground Level Ozone: Regulatory Actions," accessed February 2, 2016
- ↑ 31.0 31.1 U.S. Environmental Protection Agency, "Overview of EPA's Proposal to Update the Air Quality Standards for Ground-Level Ozone," November 25, 2014 Cite error: Invalid
<ref>tag; name "overview" defined multiple times with different content - ↑ 32.0 32.1 32.2 Congressional Research Service, "Federal Land Ownership: Overview and Data," December 29, 2014 Cite error: Invalid
<ref>tag; name "CRSoverview" defined multiple times with different content - ↑ High Country News, "This year’s GOP platform pushes federal land transfers," July 14, 2016
- ↑ U.S. Congressional Research Service, "Federal Lands and Natural Resources: Overview and Selected Issues for the 113th Congress," December 8, 2014
- ↑ High Country News, "State bills to study federal-to-state land transfers," April 30, 2015
- ↑ U.S. Fish and Wildlife Service, "ESA Overview," accessed October 1, 2014
- ↑ 37.0 37.1 U.S. Fish and Wildlife Service, "Species listed in each state based on published historic range and population data," accessed May 30, 2016
- ↑ 38.0 38.1 Democratic Platform Committee, "2016 Democratic Party Platform," July 8-9, 2016
- ↑ 39.0 39.1 39.2 39.3 Note: This text is quoted verbatim from the original source. Any inconsistencies are attributable to the original source.
- ↑ 40.0 40.1 Republican National Convention, "Republican Platform 2016," accessed August 5, 2016
- ↑ Libertarian Party, "Platform," archived August 23, 2016
- ↑ Green Party, "The 2016 Green Party Platform on Ecological Sustainability," archived August 28, 2016
- ↑ The Guardian, "Hillary Clinton on east coast oil drilling: 'So little to gain and so much to lose,'" December 17, 2015
- ↑ Politico, "Hillary Clinton's climate army," August 11, 2016
- ↑ The Hill, "Clinton open to ‘conversation’ on carbon tax," July 26, 2016
- ↑ NextGen Climate, "HUGE NEWS: BERNIE SANDERS JOINS HILLARY CLINTON IN ENDORSING #50BY30," February 9, 2016
- ↑ Hillary for America: The Briefing, "Hillary Clinton Statement on the Paris Climate Change Agreement," accessed December 14, 2015
- ↑ TIME, "Hillary Clinton Announces Plan to Protect Coal Communities," November 12, 2015
- ↑ The Wall Street Journal, "Hillary Clinton Previews Plans to Combat Climate Change," July 26, 2015
- ↑ YouTube, "Stand for Reality," July 26, 2015
- ↑ CNN, "First on CNN: Clinton campaign pledges to be carbon neutral, aide says," July 28, 2015
- ↑ The Hill, "Hillary Clinton: Climate changing 'no matter what deniers may say,'" accessed February 2, 2015
- ↑ CNN Politics, "Hillary Clinton opposes Keystone XL pipeline," September 22, 2015
- ↑ USA Today, "Hillary Clinton says she opposes Keystone XL Pipeline," September 22, 2015
- ↑ Politico, "Hillary Clinton steers clear of Keystone," July 27, 2015
- ↑ The New York Times, "Transcript: Democratic Presidential Debate in Brooklyn," April 15, 2016
- ↑ The New York Times, "Transcript of the Democratic Presidential Debate in Flint, Mich.," March 6, 2016
- ↑ National Journal, "Hillary Clinton: Arctic Drilling 'Not Worth The Risk,'" August 18, 2015
- ↑ Politico, “Hillary Clinton talks climate change, gas and exports to friendly energy crowd," September 4, 2014
- ↑ Congress.gov, "S.22 - Omnibus Public Land Management Act of 2009," accessed February 2, 2015
- ↑ Congress.gov, "S.Amdt.272 to S.Con.Res.23," accessed February 2, 2015
- ↑ YouTube, "Full Speech: Donald Trump Speech at Shale Insight Conference in Pittsburgh, Pennsylvania (9/22/2016)," September 22, 2016
- ↑ USA Today, "Donald Trump tells Californians there is no drought," May 28, 2016
- ↑ The Huffington Post, "Donald Trump Taps Climate Change Skeptic As Key Energy Adviser," May 13, 2016
- ↑ Twitter, "Donald J. Trump, August 24, 2012," accessed June 18, 2015
- ↑ Trump, Donald. (2011). Time to Get Tough. Washington, DC: Regnery Publishing. (page 24)
- ↑ Examiner, "Donald Trump: 'Beyond the nuclear' American energy solutions - Full transcript," March 16, 2011
- ↑ DonaldJTrump.com, "Trump campaign statement on Paris Climate Accord," October 5, 2016
- ↑ Politico, "Trump adviser denies climate change is manmade," September 27, 2016
- ↑ Scientific American, "What Do the Presidential Candidates Know about Science?" September 13, 2016
- ↑ The Guardian, "Donald Trump would allow Keystone XL pipeline and end Paris climate deal," May 26, 2016
- ↑ Donald Trump for President, "An America First Energy Plan," May 26, 2016
- ↑ CNN, "Donald Trump's energy plan: Regulate less, drill more," May 27, 2016
- ↑ Media Matters, "Fox Regular Donald Trump Decries Climate Change 'Hoax,'" January 6, 2014
- ↑ Twitter, "Donald J. Trump, November 6, 2012," accessed June 18, 2015
- ↑ The Federalist, "Trump Boosts Anti-Fracking Measure, Upends Swing State Energy Fight," August 5, 2016
- ↑ FOX News, "Trump to GOP: Stop playing into President Obama's hands," January 18, 2012
- ↑ NPR, "Libertarian Nominee Gary Johnson Delivers Economic Speech In Detroit," September 14, 2016
- ↑ 79.0 79.1 JohnsonWeld, "Environment," accessed September 1, 2016
- ↑ YouTube, "Gary Johnson on Keystone pipeline," March 24, 2012
- ↑ Gary Johnson 2012, "Environment," accessed January 9, 2016
- ↑ Scott Holleran, "Interview with Gary Johnson," August 21, 2011
- ↑ Washington Examiner, "Gary Johnson: I'll cut your taxes," July 10, 2016
- ↑ CNBC, "Libertarian Gary Johnson on 2016: 'This is the demise of the Republican Party'," August 22, 2016
- ↑ NPR, "Johnson Discusses Seeking Libertarian Nomination," December 30, 2011
- ↑ Politico, "Morning Energy," November 18, 2011
- ↑ The Hill, "Jill Stein charged over pipeline protest," September 7, 2016
- ↑ Fox Business, "Jill Stein: Ending Fossil Fuels Is a 'Tough Job'," August 26, 2016
- ↑ Twitter, "Dr. Jill Stein," August 11, 2016
- ↑ Jill Stein for President, "Stein Says Gov. Snyder Should Be Prosecuted For Flint Crisis. Calls for New Water Infrastructure Through A Green New Deal to End Nationwide Drinking Water Crisis," January 24, 2016
- ↑ The Harvard Crimson, "Harvard Grad Jill Stein Faces Uphill Battle for Presidency," November 29, 2015
- ↑ Jill 2016, "Power to the People Plan," accessed July 7, 2015
- ↑ Washington Post, "Green Party presidential candidate Jill Stein charged with trespassing in Keystone XL protest," October 31, 2012
- ↑ 94.0 94.1 94.2 94.3 94.4 Jill Stein for President, "Issues," accessed July 6, 2015
- ↑ JillStein2016.com, "Press Release: Obama's Carbon Deal Won't Avoid Climate Change," June 28, 2016
- ↑ TheRealNews.com, "Days of Revolt: The Problem," February 15, 2016
- ↑ Green Party USA, "Stein: UN Process has failed to save climate: People must act," accessed December 11, 2015
Categories: [Storylines, 2016] [Public policy newsletters and special reports] [Public_policy_in_the_2016_election]
↧ Download as ZWI file | Last modified: 03/06/2026 11:33:04 | 23 views
☰ Source: https://ballotpedia.org/Environmental_policy_disputes_in_the_2016_elections | License: CC BY-SA 3.0